Quant Base

undefined logo

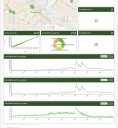
Visualising data, that is our strength! We developed the Smart Graph a web-based interactive dashboard that can handle all kind of data sets, on-site or in the Cloud. We work with Open data, data from sensors in Smart Industry or Smart cities but also data from organisational departments; HR, Sales, Finance a.s.o. It even can be defined as a portal to inform the public.

1 organisation member

Activity

  • 1
    Updates
  • 0
    Thumbs up
  • 1
    Comments
Cint Kortmann, CEO at Quant Base, posted

Realtime visualisation air quality

Featured image

On https://lucht.smartgraph.bi we visualise the measurements of air quality in 4 cities (others can be added) on our independent data platform, Smart Graph. The graphs on Apeldoorn and Dordrecht are real time.
We have screen shots on the situation on new year eve for the Fine dust (pm2,5 and pm10) and noise (decibel) , nice to see the peak and the huge differences. Apeldoorn can be seen on the LinkedIn page of Quant-Base.

Cint Kortmann's picture #Citizens&Living