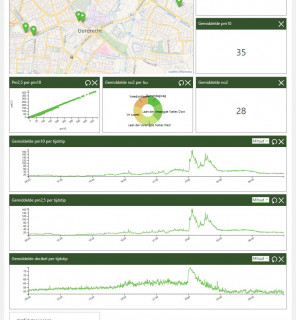
On https://lucht.smartgraph.bi we visualise the measurements of air quality in 4 cities (others can be added) on our independent data platform, Smart Graph. The graphs on Apeldoorn and Dordrecht are real time.
We have screen shots on the situation on new year eve for the Fine dust (pm2,5 and pm10) and noise (decibel) , nice to see the peak and the huge differences. Apeldoorn can be seen on the LinkedIn page of Quant-Base.
Realtime visualisation air quality