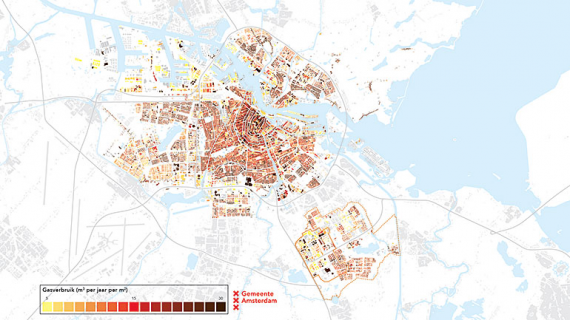
The Energy Atlas stimulates the use of renewable energy, as citizens will become more aware of their own energy usage and realise that there are gains to be made.
Energy Atlas
What is the goal of the project?
How much energy does my neighbourhood use? How much heat is produced by that nearby industrial park? What are the opportunities for using solar or wind energy? What are the possibilities of matching the demand for energy with the (renewable) energy supply? The interactive Energy Atlas for Amsterdam will answer all these questions.
The city of Amsterdam expects the Energy Atlas to stimulate the use of renewable energy, as citizens will become more aware of their own energy usage and realise that there are gains to be made. Companies will be able to determine their own usage and that of others and find out where renewable sources of energy and the energy infrastructure are located.
The Energy Atlas is one of the instruments Amsterdam can utilize to advance the transition to a system of renewable energy (the Energy Transition). Expecting an increase of its population of 100,000 to 150,000 people, the city faces tremendous challenges.
The data is available as open data via an interactive map.Different partners have contributed data. Businesses and organizations can independently develop products and services based on these data for energy efficiency and renewable generation.
Background
The EU-project TRANSFORM is meant to accelerate a transformation of urban space in six European cities. In an urban space, living, working and mobility are transformed. In Amsterdam, Zuidoost (South-east) was chosen as TRANSFORM-area; roughly the area between the Amsterdam ArenA and AMC. The project’s name is Energiek Zuidoost. Energy is the connecting factor; the focus lies on energy use, the possibilities to produce energy locally and the reuse of sources like waste heat.
In preparation for Energiek Zuidoost, the energy situation in Amsterdam has been mapped and collated in the Energy Atlas. The opportunities for generating and the mutual exchange of energy in Southeast is thus imaged and analyzed. The methodology that produced this body of information can be used to map other areas.
What is the result of the project?
The Atlas showed that there are many opportunities for the use of local waste heat, such as offices, data centers and the AMC. At this moment the municipality of Amsterdam and Amsterdam Smart City are discussing this matter with AMC, Amsterdam Arena, Ikea, NUON en Liander.
Who initiated the project and which organizations are involved?
TNO, Liander, Waternet, Alliander, Gemeente Amsterdam, Vattenfall-Nuon



Same as below: Is this atlas still available somewhere? Is it accessible as open data
Is this atlas still available somewhere? As open data