Micdrop 12 - Things that predict
 http://bit.ly/micdrop12
http://bit.ly/micdrop12
http://bit.ly/micdrop12
Get notified about new updates, opportunities or events that match your interests.
In 2018, the first paper on the Near Future in Cities of Things was published. Seven years later, we took the initiative to conduct exploratory research to reflect on the state of cities of things. Or, put differently: how should we assess the current state of urban robotics and physical AI?
In this interactive event, Iskander Smit will present the learnings from the research, and a panel of four of the approximately 25 interviewed experts will share their perspectives to kick off a discussion led by moderator Monique van Dusseldorp.
The central question is how the developments might impact and inspire the design of future cities, things, intelligent systems, and the interplay between these.
The panelists
Monique will involve other interviewed experts and participants in the event to reflect on the impact of urban robotics and physical AI on the practice of creative industries, design methods, and on relations between humans and AI.
Before and after, there will be space to connect with other participants and explore the current Wijkbots.
Schedule:
15h00 - Doors open, mingle, explore Wijkbots
16h00 - Welcome and introduction to the results of the research by Iskander Smit
16h30 - Introductions of the positions by the panelists
17h00 - Interactive discussion with panel, participants
18h00 - Wrap up and drinks with bites
20h00 - End
If you can only join part of the event, you are welcome to join later.
Find more details about the program on the <strong>Cities of Things website</strong>.
The event is powered by CLICKNL, and registration is free, including drinks.
Tijdens de Staat van het Internet steekt Waag Futurelab jaarlijks de peilstok in het internet. Deze editie staat in het teken van AI en de grenzen van onze planeet. De lezing wordt verzorgd door Fieke Jansen, mede-oprichter van het critical infrastructure lab van de Universiteit van Amsterdam.
Generatieve AI en andere AI-toepassingen worden op dit moment overal toegevoegd aan onze tech. Van zoekmachines en sociale media tot kantoorsoftware en stedelijke infrastructuur: AI is overal, of we het willen of niet. Ons digitale landschap verandert flink, maar ons fysieke landschap misschien nog wel ingrijpender. Door de komst van grote datacenters, zogenoemde hyperscalers, neemt de druk op ons stroomnet en watervoorziening flink toe. Omwonenden zien hun energierekening stijgen en watergarantie afnemen.
Dit jaar kijken we naar wat er achter onze schermen schuilt: welke impact heeft de groeiende honger naar datacenters en AI rekenkracht op onze leefomgeving? De mogelijkheden van AI lijken onbeperkt, maar de natuurlijke bronnen van onze aarde hebben een limiet.
Aansluitend aan de lezing vinden twee panelgesprekken plaats. In het eerste panel gaan we met Nestor Siré, multimedia kunstenaar en Judith Veenkamp, hoofd programma Waag Futurelab in gesprek over regeneratieve tech. In het tweede panel verkennen we met Roel Dobbe, assistent professor TU Delft en Swaan Dekkers, Innovatie Lead AI bij de Gemeente Amsterdam, de machtsstructuren die schuilgaan achter de gelikte AI interfaces.
| 15:45 - 16:00 uur | Inloop |
|---|---|
| 16:00 - 17:00 uur | Lezing door Fieke Jansen |
| 17:00 - 17:30 uur | Panelgesprek regeneratieve tech |
| 17:30 - 18:00 uur | Panelgesprek machtsstructuren |
De lezing wordt dit jaar gegeven door Fieke Jansen. Zij is co-prinicipal onderzoeker bij het critical infrastructure lab van de Universiteit van Amsterdam, en co-lead van de Green Screen Coalition. Jansen onderzoekt hoe de infrastructuur van onze digitale wereld, datacenters en AI invloed hebben op milieu, grondstoffengebruik en klimaat.
Waag Futurelab ontwikkelt onderzoek en ontwerp van regeneratieve technologie: systemen die niet alleen nemen, maar ook herstellen en teruggeven. Samen met het critical infrastructure lab onderzoekt Waag het gebruik van biomaterialen, het ontwerpen voor een langere levensduur en aandacht voor publieke waarden. Via praktijkgericht onderzoek en participatief ontwerpen combineert Waag wetenschap, kunst en burgerinitiatieven om technologie te maken die ecosystemen en gemeenschappen versterken in plaats van uitputten.
Mocht je krap bij kas zitten en wel graag aan dit evenement willen deelnemen, neem dan contact op met kelly [@] waag [punt] org.
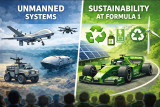
Unmanned systems; Developments & challenges
<strong>Pieter Elands,</strong> Program Manager Unmanned Systems at TNO, is an experienced manager of people and complex research programs. Pieter will share insights into the latest developments and key challenges in the field of unmanned systems. With a strong background in Aerospace and Defence, responsibility for coordinating research on unmanned systems and extensive knowledge of how unmanned systems are deployed in today’s military operations, the talk will explore technological, organizational, and strategic challenges.
Sustainability at the F1 Heineken Dutch Grand Prix
Dimitri Bonthuis is director Media & Sports Development at SportVibes and currently involved in major events like ABN AMRO Open and F1 Heineken Dutch Grand Prix. At the Dutch GP he is responsible for sustainability. This evening, Dimitri will talk about his experiences with sustainability at the Grand Prix, exploring how he approaches the topic, which innovations have been key, the challenges of driving sustainable initiatives, and how these efforts fit into a broader strategic vision.
21.00 Networking with coffee/tea

