The fifth episode of the series Better cities: The role of technology is about the sense and nonsense of big data. Data is the new oil is the worst cliché of the big data hype yet. Even worse than data-driven policy. In this article, I investigate - with digital twins as a thread - what the contribution of data can be to urban policy and how dataism, a religion that takes over policy making itself, can be prevented (must read: Harari: Homo Deus).
I am a happy user of a Sonos sound system. Nevertheless, the helpdesk must be involved occasionally. Recently, it knew within five minutes that my problem was the result of a faulty connection cable between the modem and the amplifier. As it turned out, the helpdesk was able to remotely generate a digital image of the components of my sound system and their connections and saw that the cable in question was not transmitting any signal. A simple example of a digital twin. I was happy with it. But where is the line between the sense and nonsense of collecting masses of data?
What is a digital twin.
A digital twin is a digital model of an object, product, or process. In my training as a social geographer, I had a lot to do with maps, the oldest form of 'twinning'. Maps have laid the foundation for GIS technology, which in turn is the foundation of digital twins. Geographical information systems relate data based on geographical location and provide insight into their coherence in the form of a model. If data is permanently connected to reality with the help of sensors, then the dynamics in the real world and those in the model correspond and we speak of a 'digital twin'. Such a dynamic model can be used for simulation purposes, monitoring and maintenance of machines, processes, buildings, but also for much larger-scale entities, for example the electricity grid.
From data to insight
Every scientist knows that data is indispensable, but also that there is a long way to go before data leads to knowledge and insight. That road starts even before data is collected. The first step is assumptions about the essence of reality and thus the method of knowing it. There has been a lot of discussion about this within the philosophy of science, from which two points of view have been briefly crystallized, a systems approach and a complexity approach.
The systems approach assumes that reality consists of a stable series of actions and reactions in which law-like connections can be sought. Today, almost everyone assumes that this only applies to physical and biological phenomena. Yet there is also talk of social systems. This is not a question of law-like relationships, but of generalizing assumptions about human behavior at a high level of aggregation. The homo economicus is a good example. Based on such assumptions, conclusions can be drawn about how behavior can be influenced.
The complexity approach sees (social) reality as the result of a complex adaptive process that arises from countless interactions, which - when it comes to human actions - are fed by diverse motives. In that case it will be much more difficult to make generic statements at a high level of aggregation and interventions will have a less predictable result.
Traffic models
Traffic policy is a good example to illustrate the distinction between a process and a complexity approach. Simulation using a digital twin in Chattanooga of the use of flexible lane assignment and traffic light phasing showed that congestion could be reduced by 30%. Had this experiment been carried out, the result would probably have been very different. Traffic experts note time and again that every newly opened road becomes full after a short time, while the traffic picture on other roads hardly changes. In econometrics this phenomenon is called induced demand. In a study of urban traffic patterns between 1983 and 2003, economists Gilles Duranton and Matthew Turner found that car use increases proportionally with the growth of road capacity. The cause only becomes visible to those who use a complexity approach: Every road user reacts differently to the opening or closing of a road. That reaction can be to move the ride to another time, to use a different road, to ride with someone else, to use public transport or to cancel the ride.
Carlos Gershenson, a Mexican computer specialist, has examined traffic behavior from a complexity approach and he concludes that self-regulation is the best way to tackle congestion and to maximize the capacity of roads. If the simulated traffic changes in Chattanooga had taken place in the real world, thousands of travelers would have changed their driving behavior in a short time. They had started trying out the smart highway, and due to induced demand, congestion there would increase to old levels in no time. Someone who wants to make the effect of traffic measures visible with a digital twin should feed it with results of research into the induced demand effect, instead of just manipulating historical traffic data.
The value of digital twins
Digital twins prove their worth when simulating physical systems, i.e. processes with a parametric progression. This concerns, for example, the operation of a machine, or in an urban context, the relationship between the amount of UV light, the temperature, the wind (speed) and the number of trees per unit area. In Singapore, for example, digital twins are being used to investigate how heat islands arise in the city and how their effect can be reduced. Schiphol Airporthas a digital twin that shows all moving parts at the airport, such as roller conveyors and stairs. This enables technicians to get to work immediately in the event of a malfunction. It is impossible to say in advance whether the costs of building such a model outweigh the benefits. Digital twins often develop from small to large, driven by proven needs.
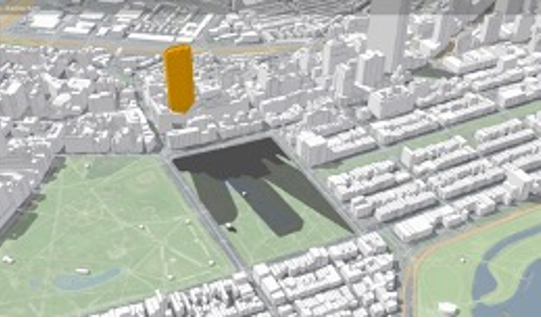
Boston also developed a digital twin of part of the city in 2017, with technical support from ESRI. A limited number of processes have been merged into a virtual 3D model. One is the shadowing caused by the height of buildings. One of the much-loved green spaces in the city is the Boston Common. For decades, it has been possible to limit the development of high-rise buildings along the edges of the park and thus to limit shade. Time and again, project developers came up with new proposals for high-rise buildings. With the digital twin, the effect of the shadowing of these buildings can be simulated in different weather conditions and in different seasons (see image above). The digital twin can be consulted online, so that everyone can view these and other effects of urban planning interventions at home.
Questions in advance
Three questions precede the construction of a digital twin, and data collection in general. In the first place, what the user wants to achieve with it, then which processes will be involved and thirdly, which knowledge is available of these processes and their impact. Chris Andrews, an urban planner working on the ESRI ArcGIS platform, emphasizes the need to limit the number of elements in a digital twin and to pre-calculate the relationship between them: To help limit complexity, the number of systems modeled in a digital twin should likely be focused on the problems the twin will be used to solve.
Both the example of traffic forecasts in Chattanooga, the formation of heat islands in Singapore and the shadowing of the Boston Common show that raw data is insufficient to feed a digital twin. Instead, data are used that are the result of scientific research, after the researcher has decided whether a systems approach or a complexity approach is appropriate. In the words of Nigel Jacob, former Chief Technology Officer in Boston: For many years now, we've been talking about the need to become data-driven… But there's a step beyond that. We need to make the transition to being science-driven in ...... It's not enough to be data mining to look for patterns. We need to understand root causes of issues and develop policies to address these issues.
Digital twins are valuable tools. But if they are fed with raw data, they provide at best insight into statistical connections and every scientist knows how dangerous it is to draw conclusions from that: Trash in, trash out.
If you prefer the Dutch version of the Better cities series, find an overview of the already published episodes via the link below.