Amsterdam, a city with an ambitious goal of becoming fully circular by 2050, envisions a future where materials are continuously reused, waste is minimized, and resource cycles are closed. Achieving this vision hinges on the availability and analysis of data, which allows us to assess the extent to which materials are used, reused, or wasted. However, this data is often elusive, complex to analyse, and, in some cases, not even recorded. These challenges surrounding circular data were the focal point of our recent event, "Data Dilemma's: Collecting Data for the Circular Economy."
During Data Dilemma's, we explore the possibilities for using data and new technologies to address urban and societal challenges, with a focus on responsible digitalization. The goal is to use data to make cities more safe, clean and accessible. But what happens to all the data that is collected? Which dilemmas do we encounter when we collect (personal) data to improve the city.
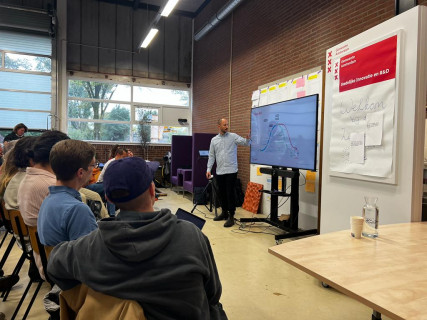
Apparently, the topic of this edition of Data Dilemma’s was not only of interest to the Amsterdam Smart City team, since this event was completely sold out. This was no surprise, with the three incredible speakers we had lined up: Mersiha Tepic (municipality of Amsterdam), Maarten Sukel (Picnic), and Joris Bouwens (Metabolic).
Mersiha Tepic: Circular Economy Monitor Amsterdam
Mersiha Tepic, Senior Researcher at the Research & Statistics department of the Municipality of Amsterdam, demonstrated the Circular Economy Monitor Amsterdam. This essential tool tracks Amsterdam's progress towards a circular economy and identifies areas requiring further attention.
The monitor gives interesting insights. For instance, it shows that the environmental impact of food is four times as big as the impact of the built environment, even though the amount of materials used in the built environment is four and a half times larger than for food.
It reveals that food has a very high environmental per kilogram compared to materials from the built environment. This is interesting because it makes the total environmental impact of food much higher than the impact of the built environment, even though the built environment uses four times as much mass in materials than food.
For more information on the circular monitor and all its insights, you can check out their (Dutch) website.
During her presentation, Mersiha also delved into the data dilemma she faces in this project—the scarcity of data from significant commercial entities operating within the city. The lack of data from these key players poses a considerable challenge to Amsterdam's circular ambitions, and Mersiha's work sheds light on the importance of bridging these data gaps.
Maarten Sukel: Data-Driven Precision at Picnic
Our second speaker, Maarten Sukel, a Data Scientist at Picnic Technologies, showcased how the online supermarket Picnic leverages data. He presented an innovative approach that combines traditional data sources with images, written descriptions, and geographical information to predict customer preferences accurately. By doing so, Picnic not only optimizes its supply chain but also minimizes waste, aligning with the circular economy's core principles.
Maarten's insights provided a glimpse into how data-driven precision can be a game-changer in the pursuit of sustainability and waste reduction, and he also gave a convincing sales pitch on why you should be a customer of Picnic.
Joris Bouwens: The Promise of Digital Product Passports
Closing the event was Joris Bouwens, a Project Manager and Senior Consultant at Metabolic's Circular Industries team. Joris shed light on Digital Product Passports and their potential to revolutionize the circular economy. These passports offer a comprehensive digital record of a product's lifecycle and environmental impact, empowering consumers to make informed choices and encouraging responsible consumption and recycling.
Joris's presentation highlighted the immense opportunity presented by Digital Product Passports in getting as much value from used products as possible. To fully illustrate the potential of Digital Product Passport, Metabolic has created a visualization of the data flows in four sectors: Electronics, Chemicals, Apparel, and Construction. You can find these visualizations here.
We extend our gratitude to our amazing speakers for their invaluable contributions and to our engaged audience for their active participation in the discussion.
In the next edition of Data Dilemma’s we will delve into the fascinating world of the underground. What cables, tubes, and other assets can be found there, how is the data on these assets shared, and how can we improve collaboration? We hope to see you there on the 26th of October.
Do you have any suggestions for which Data Dillema's we should uncover next? Let us know in the comments below.