At Edinburgh Napier University and Politecnico di Milano, we are trying to better understand how the development process of smart city strategies is structured and which guiding principles need to be considered. We are doing that by learning from European good practices, like Amsterdam.
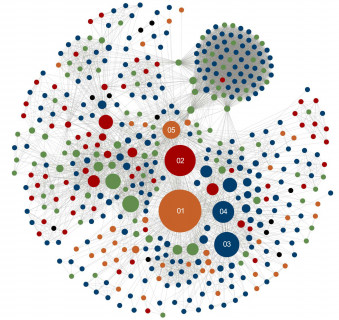
Here is one of our outputs: the collaborative network that made it possible to develop the Amsterdam Smart City Strategy. This graph shows how the journey towards becoming a smart city is complex. A journey which is based on a strong leadership, political commitment, the balance between top-down and bottom-up approach and, above all, cross-sector collaboration!
The statistics describing the structure of the network is going to be published in the next months. Each dot represents an organisation collaborating in the development of the Amsterdam Smart City Strategy. Organisations are split in four groups: Businesses (blue); Universities and research institutes (green); governmental authorities (red); other (orange); undefined (black). Edges are used to link those organisations which have worked together. The bigger the diameter of the circle, the more the organisation is connected with other organisations of the system.


This is very interesting! Looks great! I'm very curious which method you used.