Niet meer eindeloos zoeken naar een plek voor je auto als het druk is, maar direct naar straten met vrije parkeerplaatsen rijden. Dat kan dankzij een nieuwe parkeerapp. In Hoofddorp is hiermee vorige week een proef van zes maanden gestart. Iedereen die in Hoofddorp woont, werkt of er regelmatig komt, kan de app gratis testen en feedback geven.
Want to receive updates like this in your inbox?
Get notified about new updates, opportunities or events that match your interests.
Maybe you will also like these updates
Cenex Webinar #2 - EV Chargers: How to know where to place them?

Join us for an exclusive webinar featuring three leading European cities sharing their proven strategies for EV charging infrastructure placement. Learn from real-world experiences and discover data-driven approaches that are transforming urban mobility across Europe.
𝗪𝗵𝗮𝘁 𝗬𝗼𝘂'𝗹𝗹 𝗟𝗲𝗮𝗿𝗻
🏙️ 𝗦𝘁𝗿𝗮𝘁𝗲𝗴𝗶𝗰 𝗣𝗹𝗮𝗰𝗲𝗺𝗲𝗻𝘁 𝗔𝗽𝗽𝗿𝗼𝗮𝗰𝗵𝗲𝘀 - Discover how Brighton & Hove, Oslo, and Metropolitan Region of Amsterdam Electric have developed their EV charging strategies
📊 𝗗𝗮𝘁𝗮-𝗗𝗿𝗶𝘃𝗲𝗻 𝗗𝗲𝗰𝗶𝘀𝗶𝗼𝗻 𝗠𝗮𝗸𝗶𝗻𝗴 - Learn about the tools and methodologies these cities use to optimize charging point locations
🚗 𝗦𝗲𝗿𝘃𝗶𝗻𝗴 𝗔𝗹𝗹 𝗥𝗲𝘀𝗶𝗱𝗲𝗻𝘁𝘀 - Understand how to address the needs of residents without private parking spaces
🌍 𝗜𝗻𝘁𝗲𝗿𝗻𝗮𝘁𝗶𝗼𝗻𝗮𝗹 𝗕𝗲𝘀𝘁 𝗣𝗿𝗮𝗰𝘁𝗶𝗰𝗲𝘀 - Gain insights from three different countries and municipal perspectives
💡 𝗟𝗲𝘀𝘀𝗼𝗻𝘀 𝗟𝗲𝗮𝗿𝗻𝗲𝗱 - Avoid common pitfalls and learn from real implementation experiences
𝗙𝗲𝗮𝘁𝘂𝗿𝗲𝗱 𝗦𝗽𝗲𝗮𝗸𝗲𝗿𝘀
Kieran Fitsall - Brighton & Hove Council
Sture Portvik & Sara Teige Kalsaas - City of Oslo
Annekee de Jager - MRA-e (Amsterdam Metropolitan Region)
Hosted by Sanne van Breukelen - Cenex Nederland
𝗪𝗵𝘆 𝗔𝘁𝘁𝗲𝗻𝗱?
With Europe requiring 6.8 million public charging points by 2030, municipalities face unprecedented challenges in planning and implementing EV infrastructure. This webinar brings together three cities that have successfully navigated these challenges, offering practical insights for:
- Municipal planning departments
- Urban mobility professionals
- EV infrastructure developers
- Policy makers and city officials
- Transport consultants
𝗞𝗲𝘆 𝗧𝗼𝗽𝗶𝗰𝘀 𝗖𝗼𝘃𝗲𝗿𝗲𝗱
- Historical approaches vs. modern data-driven strategies
- Stakeholder engagement
- Grid capacity considerations and smart charging integration
- On-street charging solutions for urban residents
𝗪𝗵𝗼 𝗦𝗵𝗼𝘂𝗹𝗱 𝗔𝘁𝘁𝗲𝗻𝗱
This webinar is essential for anyone involved in:
- Urban planning and development
- Sustainable transport initiatives
- EV infrastructure deployment
- Municipal policy development
- European mobility strategy
𝗥𝗲𝗴𝗶𝘀𝘁𝗿𝗮𝘁𝗶𝗼𝗻
Don't miss this opportunity to learn from Europe's leading cities in EV infrastructure planning. Register now to secure your spot and gain access to exclusive insights that could transform your city's approach to EV charging.
---
This webinar is part of Cenex's ongoing commitment to accelerating the transition to sustainable transport through knowledge sharing and best practice dissemination across European cities.
Demoday #28: From Policy to Practice: Inclusive Design Ambitions of the Amsterdam Transport Authority

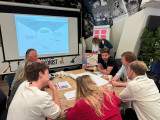
On the 5th of June, during the 28th Knowledge and Demo Day, we explored the topic of Inclusive Design in the context of mobility projects together with a diverse group of network partners. Iris Ruysch introduced the theme on behalf of the Amsterdam Transport Authority (Vervoerregio), while David Koop and Lotte de Wolde from our knowledge partner Flatland facilitated the session format, moderation and visual notes.
The ambition of the Amsterdam Transport Authority
The Amsterdam Transport Authority is responsible for public transport across fourteen municipalities in the region and is working towards a mobility system that enables people to travel quickly, safely and comfortably by public transport, bicycle or car. In addition to organising and funding public transport and investing in infrastructure, the Authority actively contributes to broader societal goals such as sustainability, health and inclusivity.
Inclusive mobility is one of the key themes within the wider mobility policy. The central principle is that everyone – regardless of age, income, disability, gender or background – should be able to travel well and comfortably throughout the region. This calls for a mobility system that is accessible, affordable, appropriate, socially safe and welcoming.
The aim of the session on 5 June was to work with the network towards an initial action plan for applying inclusive design principles in mobility projects. Iris is keen to ensure that the ambitions around inclusivity are not only stated in policy and vision documents but are truly embedded in the organisation – from policymakers to implementation teams.
Session set-up
After an introduction by Iris on the context and ambitions within the Transport Authority, we got to work. In small groups, participants explored the profile of the implementing civil servant (using a persona canvas) and considered desirable changes in approach; in terms of attitude, skills and collaboration.
We then used the Inclusive Design Wheel to examine how existing programme components of the Authority could be made more inclusive. In pairs, we tackled themes such as accessible travel information, social safety at stations (specifically for women), and improving bicycle parking facilities.
The Inclusive Design Wheel is an iterative process model that supports the structural integration of inclusivity into design and policy projects. The model emphasises collaboration, repetition, and continuous learning. It consists of four phases:
- Explore: Gather insights about users, their needs, and potential exclusion.
- Create: Develop ideas, concepts, and prototypes that address inclusive needs.
- Evaluate: Test whether the designs are inclusive, collect feedback, and make improvements where necessary.
- Manage: Ensure shared understanding, set goals, engage stakeholders, and embed the process.
Outcomes and insights
While the persona profiles were being developed, I observed the group discussions and noted several important insights to take forward in the development of the action plan:
- Awareness and concrete translation: Implementation teams often already have an intrinsic motivation to contribute to inclusivity goals set in policy. However, they may not always realise how their day-to-day work can support those goals. It’s important to continuously ask the question ‘How, exactly?’. Tools like checklists, templates and practical examples can support this translation from policy to practice.
- Flexible guidelines and not ‘extra work’: Given the differences in scale, pace and content of projects, guidelines need to be flexible. There must also be sufficient room in terms of time and budget. Most importantly, these guidelines and action plans should feel supportive, not like extra rules or bureaucracy. Too many rigid frameworks can backfire.
- Interaction between policy and implementation: There is a need for more two-way communication. Implementation teams want to be involved early in policy development, especially when they will be the ones carrying it out. They also want opportunities to reflect with policymakers on whether policy is being implemented as intended. This allows for timely feedback and course-correction based on real-world experience.
- An Inclusive Design mindset: Beyond sharpened policy documents and a stronger focus on the end user, Inclusive Design also requires a mindset – one that is inquisitive and reflective. Embedding this within the organisational culture will require more than just an action plan.
What’s next
Iris collected valuable input to kick-start the development of the action plan, and participants gained a better understanding of the Amsterdam Transport Authority, the principles of Inclusive Design, and what it takes to move from policy to implementation. This summer, a trainee will start at the Transport Authority to further develop this topic and the action plan. The session, this report, and Flatland’s visual notes provide a strong foundation to build on. We’ll be meeting with Iris and David to explore how we can support this follow-up.
Would you like to learn more about any of the topics or developments mentioned in this report? Feel free to email pelle@amsterdaminchange.com.
🚨 𝗪𝗲'𝗿𝗲 𝗮𝗹𝗿𝗲𝗮𝗱𝘆 𝗮𝘁 𝟱𝟬% – 𝗮𝗻𝗱 𝘄𝗲 𝗵𝗮𝘃𝗲𝗻'𝘁 𝗲𝘃𝗲𝗻 𝗸𝗶𝗰𝗸𝗲𝗱 𝗼𝗳𝗳 𝘆𝗲𝘁! 🚨

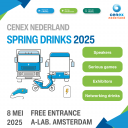
Wow! Half of the tickets for our Cenex Nederland Lenteborrel have already been ordered – and the event isn’t even happening until 8th of May 2025. 🎉
That means: lots of excitement, high expectations, and... an opportunity you don’t want to miss.
The event will be focusing on Transport & Mobility, Circular Mobility, Energy & Infrastructure, where you can expect the following.
📍 What to expect:
✅ Meet exhibitors and explore the latest innovations
🎮 Join or watch two exciting serious game sessions
🎤 Be inspired by four engaging keynotes (English)
🥂 End the day with our annual spring reception where you have the opportunity to network.
Want to join us? Don’t wait too long – the remaining 50% is likely to go even faster. 🎫
Please make sure to get your (free) ticket via Eventbrite


Hi John,
Wij publiceren binnenkort een artikel in het magazine Stadswerk en zouden graag deze foto willen gebruiken. Is dat mogelijk? Wat is je e-mail?
Dank!
Menouschka