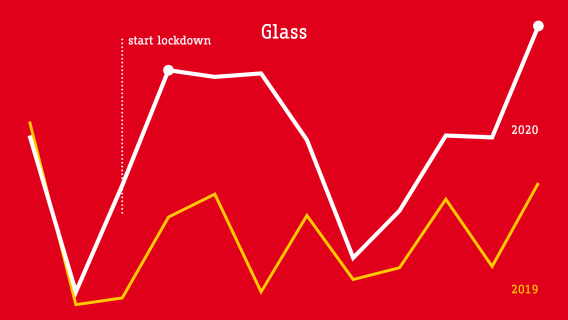
Over a year ago, the lockdown was introduced in the Netherlands. This “new normal” impacted our lives in many ways. Our data visualization team wondered: how does the lockdown impact city life?
From cardboard and glass waste numbers, happiness levels for people living in cities versus residents of rural areas to data on car traffic, water usage and CO2 emissions in the city. Check out what they investigated: https://www.ams-institute.org/news/data-visualization-how-does-lockdown-impact-city-life/