Over a year ago, national COVID-19 measures and a lockdown was introduced in the Netherlands. This “new normal” impacted our lives in many ways. Our data visualization took a deep dive into some facts and figures how the lockdown affected city life.
The following topics were reviewed:
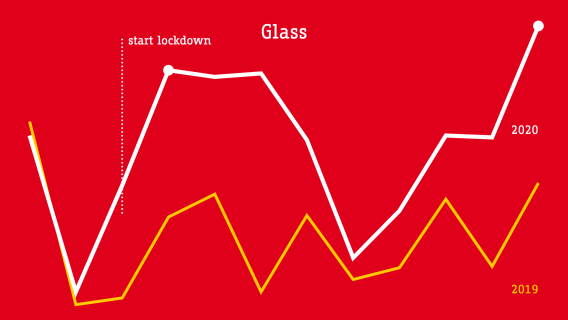
- Cardboard and glass waste
- Happiness levels and concentration problems
- Car traffic
- Water usage
- CO2 emissions
Curious to see how the lockdown affected the above? Learn more >>