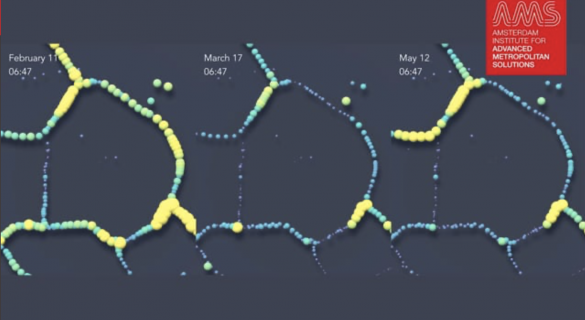
In March our government introduced measures to slow down the spread of COVID-19. As expected, this resulted in a decrease in traffic on highways. But, what does this look like? We compared 3 Tuesdays; before, during, and after the rules were loosened.
Check out this visualization, for which our Data Visualization Lab took a deep-dive into the open data of the National Data Warehouse for Traffic Information (NDW): https://www.ams-institute.org/news/traffic-intensity-during-and-after-intelligent-lockdown-measures-netherlands/