Stay in the know on all smart updates of your favorite topics.
Noor Veenhoven,
Program manager energy & circularity
at Amsterdam InChange,
posted
Demoday #28: How to keep our mechanics on the move?
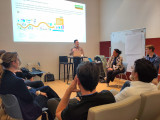
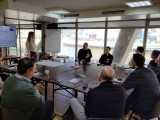
On the 5th of July, during Demoday #28, we zoomed in on one of the pressing challenges facing the energy transition: grid congestion, and more specifically, how to keep the people who maintain the grid moving efficiently.
Grid congestion is a serious and growing concern for grid operator Alliander. It is therefore essential to speed up the grid reinforcement as much as possible. Alliander’s Operation 2.0 team is exploring innovative ways to work smarter, faster, and more flexibly to keep pace with these developments.
Their efforts focus on three tracks:
• Alleviating staff shortages by training office employees to occasionally support fieldwork.
• Exploring technologies like advanced ground radar to get better insights into underground assets.
• Improving the logistics of supplying mechanics to ensure they have the right tools, in the right place, at the right time.
This last track was the main focus of our work session.
Inefficient supply of mechanics
Logistics experiences show that mechanics collect materials inefficiently when supplying their vans and jobs, resulting in stock corrections, less control over stock, unnecessary work for logistics staff, and valuable mechanic hours being lost, which leads to less execution work. A few key problems stood out:
• Supplies are scanned inconsistently, so the system doesn’t reflect what is actually in stock.
• Every van is different, with a custom layout that suits the preferences of its mechanic.
• The work itself is unpredictable, which makes standardised restocking difficult.
• With a transition to smaller electric vans, space is becoming even more limited.
A simple optimisation of the process is not enough, especially without considering the human element. For many mechanics, a visit to the supply centre is more than just logistics. It is a moment of connection, a short break from the road, or simply a chance for a good coffee.
Ideas from the network
In groups of four, we brainstormed creative ideas to improve the supply of Alliander vans while keeping the needs and routines of mechanics in mind.
Some highlights:
• Peer-to-peer van inspiration: Let mechanics share the layout of their vans with colleagues. They can exchange best practices and take pride in an efficient setup. Adding a bit of gamification might boost motivation even more.
• A mobile supply service: A supply van could drive around to restock mechanic vans, reducing the need to visit the supply centre. However, this might remove the social element of taking a break with colleagues.
• Smarter routing: Track the location of mechanics only in relation to nearby grid faults. This way, the closest available mechanic can respond without feeling like their movements are constantly being monitored.
• Package-based resupply: Inspired by delivery service Picnic, mechanics could exchange complete “supply packages” instead of picking out materials individually. Collaborating with wholesale suppliers could reveal more useful insights.
• Automatic stock tracking: Tag all materials with RFID chips and use sensors installed in the door of the van to register what is removed from the van. This eliminates the need for manual scanning and reduces the chance of mistakes.
Do you have a bright idea to improve how mechanics work? Let us know in the comments or send a message to Noor at noor@amsterdaminchange.com.
A big thank you to Thomas Hoekstra and Iris van der Zanden from Alliander for bringing this challenge to the network, and to Chantal Inia from Royal HaskoningDHV for moderating the session.
arjen groeneveld,
Data designer
,
posted
Amsterdam Data Design Den- Beyond the Graph
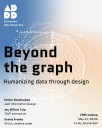
Amsterdam Data Design Den is the city's newest community meetup celebrating the intersection of data, design, and storytelling. In an era where information surrounds us, we believe in the power of creative visualization to transform complex data into compelling narratives that inspire and inform.
Every couple of months, we bring together professional designers, creative studios, and emerging talents in an informal setting to share groundbreaking projects and foster meaningful connections. Our speakers range from established design studios showcasing large-scale data visualization projects to independent designers experimenting with novel approaches to information design.
What makes our meetup unique is its commitment to accessibility and community. There's no entry fee, no membership requirements—just a gathering of curious minds passionate about using design to make sense of our data-driven world. Whether you're a seasoned information designer, a student exploring data visualization, or simply intrigued by the creative possibilities of data storytelling, you'll find your place here.
Join us for an evening of inspiration, networking, and casual conversations over drinks. Each session features thought-provoking presentations followed by open discussions, creating an environment where ideas flow freely and collaborations naturally emerge.
Amsterdam Data Design Den meets in the heart of Amsterdam, bringing together the city's vibrant creative community to explore the future of data visualization and information design.
Noor Veenhoven,
Program manager energy & circularity
at Amsterdam InChange,
posted
Underground Challenges and Shared Solutions: Lessons from Amsterdam for District Heating in Haarlemmermeer
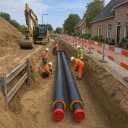
How do you install district heating in villages with narrow streets and limited underground space? This was the central question during a recent deepdive session hosted in the municipality of Haarlemmermeer. The session brought together experts from the City of Amsterdam, local officials and experts from Haarlemmermeer, and Arcadis to explore practical solutions to the physical challenges of implementing district heating in dense and complex infrastructure environments.
From complexity to coordination
Amsterdam has years of experience addressing similar challenges in dense urban areas where underground infrastructure is already under pressure. Experts from the City of Amsterdam were invited to share their approach, which combines long-term planning, integrated design processes, and flexibility in applying standards.
Some key principles they shared:
- Planning 15 years ahead: Amsterdam actively involves all utility providers to map out future plans and co-create underground infrastructure layouts.
- Using standard ways of working in the underground (WIOR) and a standardised scheme for subsurface infrastructure planning: These frameworks help assess available underground space and guide decisions when concessions are necessary.
- Embracing alternative methods: Stacking pipelines instead of placing them side-by-side, drilling under roads, or clustering transport cables in walls or consolidated zones are all viable options.
Sometimes, this requires deviating from standard spacing requirements. Such exceptions are only made with strong justification and agreement at the decision-making level.
A fresh look at Haarlemmermeer’s challenges
Participants from Haarlemmermeer acknowledged that they face several pressing issues. With limited space in the underground and a lack of an integrated planning framework, it is difficult to make informed, long-term decisions. Three villages in the municipality are particularly challenging due to their narrow streets and aging infrastructure.
Key challenges included:
- Underestimating the space needed for district heating infrastructure (including expansion loops, communication lines, and insulation).
- Rigid adherence to guidelines, which may not always be feasible locally.
- A missing coordinating role to oversee all the different parties operating in the underground to facilitate collaboration.
Shared lessons, shared responsibility
The session made clear that while every context is different, the challenges of underground infrastructure for district heating are shared across municipalities. The city of Amsterdam is a bit further ahead than Haarlemmermeer, and their expertise was already tremendously helpful. The Amsterdam case shows that smart, flexible planning—backed by clear coordination of all parties active in the underground —can lead to effective, long-term solutions.
Now the task for Haarlemmermeer is to translate these insights into concrete next steps. As one participant concluded, “We need to move from awareness to action.”
Would you like to learn more about this topic? Please contact Noor at noor@amsterdaminchange.com.
Make this your personal feed
Sem Rudolph,
Fieldlab voor de bouwsector en industrie
at BouwLab,
posted
Innovation Dinner - Cultuurverandering in de bouw
Op woensdag 26 maart organiseren BouwLab R&Do en 3D Makers Zone vanuit het programma van de EDIH het Innovation Dinner Cultuurverandering in de bouw.
De bouwsector staat op een keerpunt. Jarenlang werd er traditioneel en lineair gewerkt, maar de uitdagingen van vandaag - verduurzaming, digitalisering en circulariteit - vragen om een fundamentele transformatie. Wie niet meebeweegt, blijft achter.
Tijdens deze avond gaan we dieper in op de volgende thema's:
- Van afval naar waarde - Hoe maken we circulair bouwen de norm? Jaarlijks produceert de Nederlandse bouwsector meer dan 20 miljoen ton afval! In een wereld waar grondstoffen schaars worden, is dat onhoudbaar. Innovatieve bedrijven laten zien dat het anders kan. Gebouwen worden gesloopt met een materialenpaspoort, zodat onderdelen een tweede leven krijgen. Prefab houtbouw vervangt traditionele bouw, waardoor woningen sneller, lichter en met een lagere CO2-uitstoot gerealiseerd kunnen worden.
- Digitalisering als versneller - Hoe benutten we AI, digital twins en data? Ook digitalisering speelt een cruciale rol in de modernisering van de bouw. Digital twins, AI en big data kunnen bouwprocessen optimaliseren, terwijl drones en 3D-scans de veiligheid en nauwkeurigheid vergroten.
- <strong>Samenwerken of stagneren?</strong> - Hoe doorbreken we silo's en creëren we ketensamenwerking? Verandering komt alleen tot stand als bedrijven over hun eigen schaduw heen stappen. Ketensamenwerking, waarin partijen niet alleen contractueel maar ook inhoudelijk verantwoordelijkheid delen, is noodzakelijk voor circulariteit en digitalisering. Dat verlangt nieuwe verdienmodellen, waarbij niet alleen de laagste prijs maar de waarde op lange termijn centraal staat.
- Van traditie naar toekomst - Hoe breken we met oude patronen?
Avi Ganesan,
Project Manager, Energy System Innovation
at Resourcefully,
posted
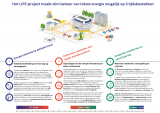
Eindconferentie: LIFE Arenapoort project (netcongestie)
Met het LIFE project in Amsterdam Zuidoost zijn we bezig met een eindconferentie te organiseren op 4 maart middag (13u-17.30) bij de Johan Cruijff Arena en je bent uiteraard van harte welkom (net als je collega's)!
Hieronder de aanmeld pagina met de programma:
[https://www.eventbrite.nl/e/tickets-eindconferentie-life-project-1206732572609](https://www.eventbrite.nl/e/tickets-eindconferentie-life-project-1206732572609 "https://www.eventbrite.nl/e/tickets-eindconferentie-life-project-1206732572609")
Het conferentie gaat over de bijdrage van het LIFE project om innovaties te realiseren om netcongestie te beheren op gebiedsniveau, <strong>in samenwerking met Alliander, Johan Cruijff Arena, Gemeente Amsterdam, TU Delft, Spectral, AMS Institute en andere tech en kennis partners</strong>. Er komen ook inspirerende keynote sprekers om de context te laten zien waarin het project opereert:
- Bart van der Laan, Programmamanager Flexibel Energiegebruik, Alliander
- Ellen Nieuwboer, Projectdirectuer gebiedsontwikkeling, Gemeente Amsterdam
- Roland Lazet (ING) & Andro Bottse (Green Business Club Zuidoost), EnergyHub Arenapoort Taskforce
Samen kijken we naar hoe de onderzoek en tools van LIFE wordt toegepast in Amsterdam Zuidoost om netcongestie op een inclusief en collectief manier te kunnen beheren.
Tot 4 maart bij de Arena!
Project Team LIFE
Martine Mars,
Projectmanager
at Resourcefully,
posted
Artikel 'Eigen opwek voor de buurt - Slim omgaan met het bestaande net'
Hugo Niesing, directeur van Resourcefully, werd geïnterviewd in het decembernummer 2024 van het gemeentelijk magazine van Amsterdam over innovatieve oplossingen voor de integratie van mobiliteit, energie en netcongestie. Het artikel laat zien hoe projecten zoals de pilot in Sporenburg in het Oostelijk Havengebied bijdragen aan een duurzaam en toekomstbestendig lokaal energiesysteem. Hier werken we met 500 huishoudens om piekuren te verminderen en lokaal opgewekte energie optimaal te benutten.
Lees hier meer over dit inspirerende initiatief via de link.
Sem Rudolph,
Fieldlab voor de bouwsector en industrie
at BouwLab,
posted
Innovation Dinner Digitale Fitheid

Vanuit het programma van de EDIH Digital Hub Noordwest organiseren BouwLab R&Do en 3D Makers Zone weer een Innovation Dinner.
In een wereld waar we allemaal werken met een scherm, is het belangrijk om stil te staan bij ‘hoe’ we daarmee werken. Hoe verwerken we informatie? Hoe slaan we informatie op? Hoe voorkomen we een overload aan mails en data? En hoe zorgen we ervoor dat we efficiënt blijven in een steeds digitaler landschap?
Om organisaties en hun medewerkers hierin te ondersteunen, heeft de overheid samen met verschillende partners de Maand van de Digitale Fitheid gelanceerd. Deze jaarlijkse campagne in maart richt zich op de digitale vaardigheden van de 4 miljoen keniswerkers in Nederland.
Samen met Martijn Aslander, een van de initiatiefnemers van deze campagne en auteur van onder andere ‘Ons werk is Stuk’, nemen we je mee in de wereld van digitale fitheid en de vijf essentiële pijlers:
- Digitaal bewustzijn
- Digitale Hygiëne
- Digitale vaardigheden
- Persoonlijk kennismanagement
- Persoonlijke groei met hulp van technologie
Kim Nathalia,
EU-project secretaris
at City of Amsterdam,
posted
Netwerkbijeenkomst Positief Energie District in de Tolhuistuin
5 jaar Amsterdam Innovatie Atelier
In Buiksloterham ontwikkelt ATELIER een wijk die meer energie opwekt dan zij verbruikt en worden slimme energietoepassingen in de praktijk gebracht.
Wat komt er allemaal kijken bij het opzetten van een energiegemeenschap, welke mogelijkheden en structuren er nodig zijn voor het actief delen van energie, hoe kunnen batterijen ingezet kunnen worden om netcongestie tegen te gaan, en hoe kan het concept data commons bijdragen aan een duurzame wijkontwikkeling?
In deze bijeenkomst blikken we terug op onze gezamenlijke resultaten en bespreken we de toekomstplannen in samenwerking met het kennisnetwerk Amsterdam InChange.
De dag wordt geopend door de Amsterdamse wethouder Dirk de Jager en georganiseerd door TNO in samenwerking met de Hogeschool van Amsterdam, AMS Institute, Waag Futurelab en gemeente Amsterdam.
Ben jij actief in het veld? Dan ben je van harte welkom en horen we graag jouw reflectie tijdens de kennissessies die zich richten op lokale energiesystemen, energiegemeenschappen, financiering en data delen.
Meld je voor 13 november aan!
Wanneer: 21 november 2024
Waar: Tolhuistuin, IJpromenade 2, Amsterdam
Ga naar de aanmeldpagina voor meer informatie over het programma en de sessies.
Het Amsterdam Innovatie Atelier is onderdeel van het Smart City EU-project ATELIER
![]()
Annelou Hoogerwerf,
Organisatieadviseur klimaattransitie
,
posted
Subsidie voor ondernemers om inzicht te krijgen in elektriciteitsverbruik: De SON subsidie van de provincie Noord-Holland

De provincie Noord-Holland heeft opnieuw de subsidieregeling Slimme Oplossingen bij Netcongestie (UVR SON) geopend. Van 1 juli tot 1 oktober 2024 kunnen bedrijven en organisaties subsidie aanvragen om inzicht te krijgen in hun elektriciteitsverbruik. Dit helpt hen om energie te besparen en hun verbruik slimmer te spreiden. De subsidie varieert van € 10.000 tot € 15.000 per aanvraag, met een totaalbudget van € 500.000.
Met deze subsidie kunnen bedrijven en organisaties slimme meet- en sturingssoftware aanschaffen waarmee je inzicht krijgt in je eigen elektriciteitsprofiel. Die meetgegevens kunnen gebruikt worden om elektriciteitsgebruik te verminderen of beter te spreiden over de dag. Lees verder op de websitelink!
Teska Drosten,
Communicator
at Waag,
posted
Inkijkjes in de energietransitie: feestelijke opening
Het valt niet meteen op, maar in Amsterdam Noord is de toekomst al begonnen. De wijk Buiksloterham loopt internationaal voorop in de energietransitie. Gebouwen in de buurt zijn aardgasvrij, en verkrijgen hun energie bijna allemaal op een andere manier. Als voorbijganger of bewoner zie je daar nu weinig van.
Het project ‘Inkijkjes in de Energietransitie’ brengt daar verandering in. Met schilderingen en kunstobjecten op straat geven we virtuele inkijkjes in de apparaten en installaties achter de muren en in kelders. In kijkbuizen met animaties wordt de werking van een warmte-koude-opslag, of het stadswarmtenet, je in een minuut uitgelegd.
De nieuwe technieken mogen gezien worden! Door een wandeling langs de verschillende inkijkjes kom je meer te weten over de verschillende facetten van de energietransitie.
Zo maken we de energietransitie tastbaar, en de discussie erover concreter.
Kom je naar de opening? Op donderdag 13 juni worden de Inkijkjes in de Energietransitie officieel geopend. We presenteren de installaties aan alle betrokkenen: van expert tot bewoner, en aan de buren.
Wanneer: Donderdag 13 juni, 16:00 - 19:00 uur
Waar: Asterdwarsweg 5, Amsterdam Noord
Meld je aan: door te mailen naar floortje [at] waag [punt] org
Het concept ‘Inkijkjes’ komt voort uit de artistieke oproep van Waag Futurelab en een intensief buurtonderzoek (bezoeken, interviews, workshops met buurtbewoners) samen met de geselecteerde ontwerper Tessa Steenkamp en haar design studio Bits of Space.
Beth Njeri,
Communications & Events Manager
at Metabolic,
posted
Reducing Carbon Footprints: Erasmus MC Leads the Way to Climate-Neutral Hospitals
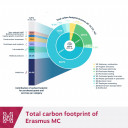
The healthcare sector is responsible for approximately 7% of all greenhouse gas emissions in the Netherlands. How can a hospital become climate-neutral?
The first step on the sustainability journey is to measure the organization’s carbon footprint. A precise carbon footprint is crucial for setting impactful and realistic targets, and for aligning with regulations and Green Deal Healthcare 3.0.
In support of Erasmus Medical Center's sustainability goals to reduce its CO2e emissions by 55% by 2030 and to achieve climate neutrality by 2050, Metabolic mapped its carbon footprint, focusing on scope 1, 2, and 3 emissions.
💡A sneak peek: 60% of Erasmus’ CO2e footprint results from indirect emissions from purchased goods and services, such as medicines.
Erasmus MC is one of the first hospitals to use this method to map emissions across all its operations. This research provides the hospital—and the entire sector—with insights into emission hotspots and highlights potential areas for impactful sustainability interventions.
Explore Metabolic's work with Erasmus in the link below
Interested in learning more about carbon footprint assessment? This is for you: https://bit.ly/3UUdMHf
#sustainability #carbonfootprintassessment #environmentalimpact #sustainablehealthcare
Noor Veenhoven,
Program manager energy & circularity
at Amsterdam InChange,
posted
Underground Challenge: Collaborating, Sharing Data, and Co-Planning
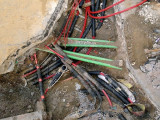
The underground is filled with infrastructure and other assets, including electricity cables, fibre optic cables, gas pipelines, heat networks, sewers, and more. Additionally, underground spaces host natural elements crucial for maintaining a healthy urban environment, such as soil essential for urban trees. Consequently, various stakeholders regularly need access to the underground, each with their own interests, creating significant pressure on the underground. Frequent excavation leads to disruptions, extensive damage, and trees that don’t age past 60 (which is very young for trees).
Improvements can be made by enhancing collaboration among stakeholders, sharing more data, and collectively planning underground activities. Understanding the interests of all involved parties is crucial to developing an action plan aimed at enhancing the quality and management of the underground.
Debby Kruit,
Advisor Startup Scaleup Ecosystem
at Gemeente Almere,
posted
Startup Hero Journey Program 2024
Join UPALMERE!'s Start-up Hero Journey 2024 and take your start-up to the next level.
Are you based in Almere or are you willing to settle there and are you willing to challenge yourself and investigate how your startup can contribute to a better world and thus scale internationally? Then this is your perfect opportunity to grow and realize your international ambitions.
The Startup Hero Journey program offers a series of inspiring sessions, masterclasses and events from late May to October that immerse you in the world of innovation and entrepreneurship. In our pre-accelerator program, you will not only develop your entrepreneurial potential under the guidance of experts and experienced mentors, but you will also discover new perspectives and join a network of like-minded entrepreneurs. Prepare for a journey that transforms your business and contributes to a more sustainable future.
Program in Dutch.
Sophie van der Ploeg,
Community Manager & Program Lead Digital
at Amsterdam InChange,
posted
Demoday #22: Data Commons Collective
In the big tech-dominated era, data has been commercially exploited for so long that it is now hard to imagine that data sharing might also benefit the community. Yet that is what a collective of businesses, governments, social institutions and residents in Amsterdam aim to do. Sharing more data to better care for the city. On behalf of the Data Commons Collective, Lia Hsu (Strategic Advisor at Amsterdam Economic Board) asked the Amsterdam Smart City network for input and feedback on their Data Commons initiative on the last Demoday of 2023.
What is a (data) common?
Commons are natural resources that are accessible to everyone within a community. Water. Fertile soil. Clean air. Actually everything the earth has given us. We as humanity have increasingly begun to exploit these commons in our pursuit of power and profit maximisation. As a result, we risk exhausting them.
Data is a new, digital resource: a valuable commodity that can be used to improve products and services. Data can thus also be used for the common good. However there are two important differences between a common and a data common: data in commons never runs out, and data in commons is not tied to any geographical location or sociocultural groups.
Four principles for Data Commons
The Data Commons collective is currently working on different applied use cases to understand how data commons can help with concrete solutions to pressing societal problems in the areas of energy, green urban development, mobility, health and culture. Each data commons serves a different purpose and requires a different implementation, but there are four principles that are always the same:
- The data common is used to serve a public or community purpose
- The data common requires cooperation between different parties, such as individuals, companies or public institutions
- The data common is managed according to principles that are acceptable to users and that define who may access the data commons under what conditions, in what ways they may be used, for what purpose, what is meant by data misuse
- The data common is embedded to manage data quality, but also to monitor compliance with the principles and ensure that data misuse is also noticed and that an appropriate response (such as a reprimand, penalty or fine) follows.
The Data Commons Collective is now in the process of developing a framework, which provides a self-assessment tool to guide the formation of Data Commons initiatives by triggering consideration of relevant aspects for creating a data commons. It is a means of reflection, rather than prescription, to encourage sustainable and responsible data initiatives.
Energy Data Commons case and Value Workshop by Waag
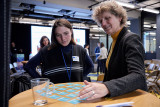
After the introduction to the Data Commons Collective and Framework by Simone van der Burg (Waag) and Roos de Jong (Deloitte), the participants engaged in a value workshop led by Simone. The case we worked with: we’re dealing with a shortage of affordable and clean energy. Congestion issues are only expected to get worse, due to increased energy use by households en businesses. An energy Data Commons in neighbourhoods can have certain benefits. Such as preventing congestion issues, using clean energy sources more effectively, becoming self-sufficient as a neighbourhood and reducing costs. But under what circumstances would we want to share our energy data with our neighbours? What are the values that we find important when it comes to sharing our energy data?
Results: Which values are important when sharing our energy data?
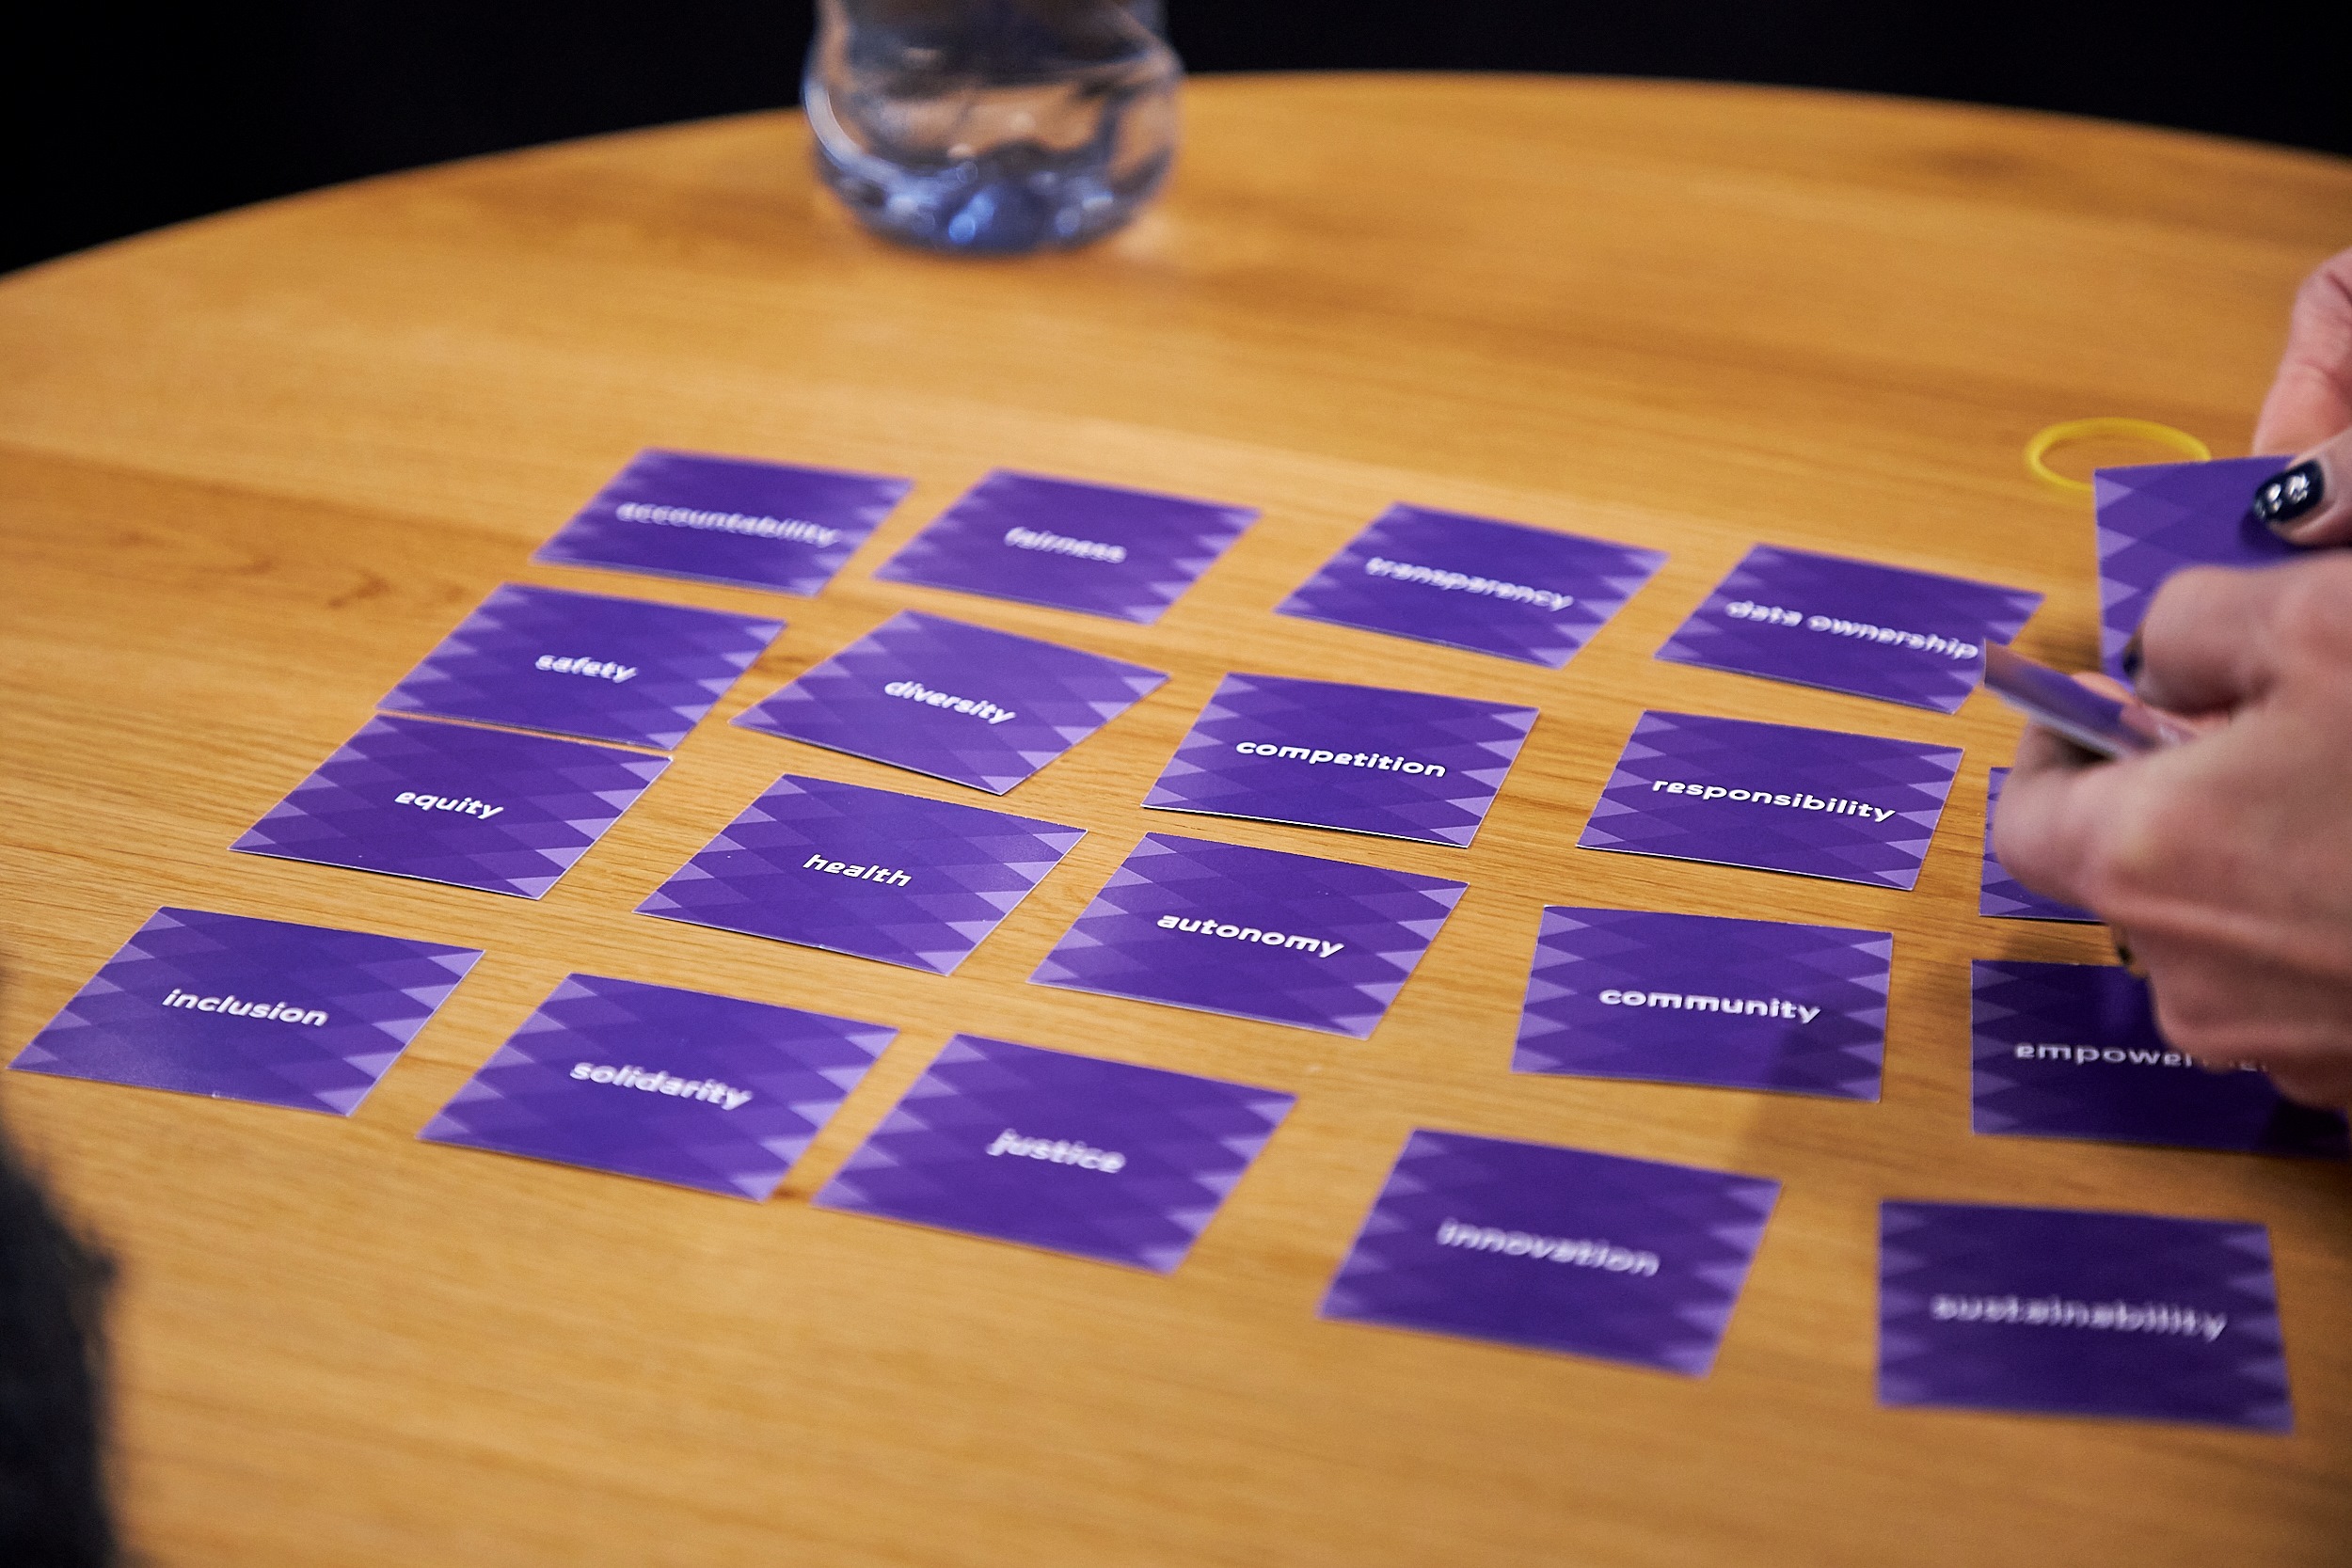
In smaller groups, the participants discussed which values they found important for an energy data common using a value card deck from Waag. Some values that were mentioned were:
- Trustworthiness: It is important to trust one another when sharing our energy data. It helps when we assume that everyone that is part of the common has the right intentions.
- Fun: The energy Data Commons should be fun and positive! The participants discussed gamification and rewards as part of the common.
- Knowledge: One of the goals of sharing data with each other is to gain more knowledge about energy consumption and saving.
- Justice and solidarity: If everyone in the common feels safe and acknowledged, it will benefit the outcome. Everyone in the common should be treated equally.
- Inclusion and Community-feeling: It is important that people feel involved in the project. The Data Commons should improve our lives, make it more sustainable but also progress our social relations.
During this Demoday, we got to know the Data Commons collective and experienced which values we find important when sharing our data with others. Amsterdam Economic Board will remain involved in the Data Commons Collective in a coordinating role and work on use cases to understand how data commons can work for society.
Would you like to know more about the Data Commons Collective or do you have any input for them? Please feel free to reach out to me via sophie@amsterdamsmartcity.com or leave a comment below.
Noor Veenhoven,
Program manager energy & circularity
at Amsterdam InChange,
posted
Demoday #22: How can we continue to facilitate homeowners in driving the energy transition?

Grid congestion is becoming increasingly significant and will start to pose a problem in the low-voltage network in the coming years. This will prevent homeowners from transitioning away from gas, result in low efficiency for their solar panels, and could make it impossible to have a charging station at their doorstep. Alliander does not want to hinder the energy transition. Therefore, they are looking for a way to involve homeowners in the issue of grid congestion and provide solutions that are still feasible with a crowded grid.
In the energy work session on the 14th of December, Wouter van Rooijen (Alliander) discussed the challenges related to grid congestion. From 2030 onwards, it is expected that a significant portion of the low-voltage network will experience both over- and under-voltage. While the network will be reinforced as quickly as possible, the lack of labour capacity is also prompting the consideration of alternative solutions.
The solution that emerged from Wouter's co-creation process was WijkWise. In this work session, Wouter aimed to validate the WijkWise concept and find parties that could contribute to its development and market implementation. Dave van Loon from Kennisland moderated the session.
WijkWise – Understanding the neighbourhood's grid situation
The WijkWise concept focuses on three problems:
- The growth of grid congestion at low-voltage
- Homeowners' uncertainty about making sustainable investments. For instance, because they may not know if their solar panels will yield a good return.
- Homeowners' lack of awareness regarding the impact their choices have on the stability of the grid.
The proposed solution:
"With WijkWise, Alliander continues to facilitate homeowners in making their homes more sustainable. Alliander does this by providing insight into the neighbourhood's grid situation and recommending the best investment. Residents can make informed choices that contribute to payback time, comfort, and certainty. A good choice benefits both the homeowner and the grid operator."
The idea is to provide more insight into the neighbourhood's grid situation and offer tailored advice for home sustainability. This way, homeowners can determine whether they should invest in insulation, a heat pump, or solar panels.
Alliander does not want to develop this concept alone, but is seeking partners to bring this concept to market.
Discussion
After the concept presentation, a brief discussion followed. The main questions raised were:
- Can providing insight into the neighbourhood's grid situation have (negative) effects on the housing market?
→ They don't know yet; further investigation is needed. - Can this data be shared freely?
→ The data shared will be at the neighbourhood level (transformer level) and not in real-time (monthly). If there is user data involved, consent must be obtained. - What behaviour change do you expect?
→ That, during the investment moment, consideration will be given to the grid situation for the most advantageous investment.
After the discussion, we worked in groups with the Empathy Canvas from Kennisland to view the WijkWise concept from the perspective of the homeowners. This tool helped us really view the problems from the perspective of a homeowner.
Empathy Mapping
In three groups, we delved into the homeowner's situation. The recurring themes in the empathy maps were:
- A sense of unfairness for the homeowner. They invest in sustainability and are rewarded with grid congestion problems.
- A feeling of uncertainty for the homeowner. They want assurance that their investment will yield results.
- Little trust in the grid operator and the government. First, everyone had to get solar panels, and now suddenly it doesn't fit, and net metering is being discontinued (or not?)
- Limited understanding by homeowners because they find it very complicated and don't want to delve into it. It's not an urgent problem for them.
- Collaboratively seeking solutions can be very positive, but can also lead to friction.
Alliander plans to take the next steps with this concept in 2024. In 2024, they are planning to do the follow-up research, make the minimal viable product, and launch the first version of the product at the end of the year.
Do you know of any stakeholders that absolutely need to be involved, or would you like to be involved in the implementation of the WijkWise concept? Please contact Noor at noor@amsterdamsmartcity.com. Special thanks to Wouter and Dave for this interesting session.
Noor Veenhoven,
Program manager energy & circularity
at Amsterdam InChange,
posted
Finding underground infrastructure without digging
Following the Data Dilemmas event in October, which focused on underground infrastructure, this deep dive session delved further into the question: How can we look under the ground without digging? The session began with an introduction by Alliander, followed by additional insights from Port of Amsterdam, Eurofiber, City of Amsterdam, and Stedin. After exploring the issue, various parties pitched their solutions.
The problem of Alliander
Alliander is anticipating a significant workload in the next 2-10 years, requiring a lot of resources (personnel, materials, and services). We are transitioning away from gas, which means that many gas connections have to be removed. Currently, Alliander is removing around 12,000 connections per year, this is expected to increase to around 100,000 in 2030.
The primary challenge in the removal process is locating the gas line. Due to missing or outdated drawings, ground subsidence, or discrepancies between installation and location, they are often difficult to locate. This leads to time-consuming and costly excavation and often excavation damage.
Alliander employs several search methods to locate the gas lines:
- Probe: This is a probe that can be entered via the main gas valve, with a transmitter so that you can trace it from the outside.
- Gas camera: Attached to the probe to see where the gas connections are.
- Ground penetrating radar (GPR): Sonar scan of the ground.
- Chenny: Similar to probe.
- Frequency on metal tubes: For metal pipes, you can set a frequency on the pipe that can be detected.
- Ultra-sonic: By putting a sound signal on the pipe you can register the vibrating gas molecules with a microphone.
These techniques are not always sufficient and come with many drawbacks. This is why Alliander is seeking a better way for technicians to know where to dig without opening the ground.
Additional Insights
Additional insights from various stakeholders highlight common challenges related to underground infrastructure. The main problem is that the data of the underground is not the same as the real-time situation. This leads to scanning methods being necessary in the first place.
The data which is documented is also lacking because it doesn’t show things such as ground pollution, and the z-coordinate (depth) is also missing. There is potential for improvement since most parties have better databases of their own assets. This data is unfortunately not shared since it is not required by KLIC (Information and Coordination Center for Underground Infrastructure).
Solution Pitches
1. SpectroAG – Hamed Mehdipoor: Combines GPR, electromagnetic wave emission, robots, and drones to scan large ground areas in high resolution. The data is analyzed by an AI Brain Cloud, providing a 3D representation of asset locations. Challenges may arise in areas with clay ground, since this is always a problem with GPR.
2. Inframent – Marina Kurnevich: A startup addressing asset registration issues. Their solution involves taking photos of open trenches with a smartphone or tablet, instantly uploading them to their application, and adding location data. This ensures immediate and accurate registration of underground data.
3. Infratags – Henk Schwietert (Evalan): Their passive (no battery) RFID tags (Infratags) can be attached to cables and connection sleeves, allowing easy identification above ground using a scanner. The low-cost tags, around 50 cents each, can easily help find tagged assets. However, challenges include conflicting interests and delayed returns on investment. The Infratag was developed in collaboration with Tallo.
4. HvA Sensorlab - Marcel van der Horst: While not offering a direct solution, HvA Sensorlab has students capable of working on the problem. They have access to advanced equipment for developing or improving solutions.
5. VLabs – Diemer Cohen Stuart: Uses GIS data and Augmented Reality (AR) to visualize accurate geodata through AR glasses. This simplifies operational work, improves quality control, and allows for on-site guidance with work instructions. The glasses provide 5-10 cm accuracy, with a cost of 8500 euros per pair.
Are you interested in any of these solutions, would you like more information, or do you have an even better solution? Please don’t hesitate to reach out to Noor – noor@amsterdamsmartcity.com, or leave a comment below. We will continue with this topic in 2024!
Ivanna Vinnicsuk,
Content Marketer
at Digital Society School,
posted
Digital Society School: Showcase Fall '23

Our Showcase is here - tap into the potential of transformation design and create transformation ripples with us!
On January 24th, come and explore the projects carried out by the trainee teams from our Digital Transformation Intensive Programme dedicated to shaping an inclusive, sustainable and diverse society. Get inspired, learn more about how Transformation Design is done and meet fellow changemakers in our Clubhouse or online via our YouTube livestream.
Our trainee projects focus on the integration of technology into society and design for the UN Sustainable Development Goals (SDGs) through topics such as Sustainability Monitoring, Digital Health & Well-being, and Regenerative Cities, among others. In 20 weeks, they learn to work responsibly and sustainably by using design, technology and social innovation together with one of our partners.
We have prepared an exciting programme for you:
16:00 - 17:00 Mini-keynotes:
- "Digital Activism" by Marleen Stikker, director & founder of Waag Futurelab
- "Learning Communities" by Zlatina Tsvetkova, Learning & Knowledge Manager at Commonland
- "Systemic Design" by Andrea Nesta, Experience Design Lead at Nomads
17:00 - 18:00 Clubhouse exhibition of design solutions of trainee teams
18:00 - 20:00 Networking & drinks
There will be plenty of opportunities to connect with the trainees, partners and the extended Digital Society School community, so don't miss out!
Christiaan Elings,
Strategy & Collaboration for Sustainable Transitions
at Royal Haskoning,
posted
Aan de slag met Digitale Transformatie: Data & AI Seminar

Wil je optimaal profiteren van data?
Ben jij volop bezig met datagedreven projecten? Wil je leren hoe je het maximale uit data kunt halen en hoe je de uitdagingen kunt tackelen? Dan mag je ons Data en AI Seminar op 30 januari absoluut niet missen. Dit event gaat verder dan enkel inspiratie; het biedt je concreet praktische tools om data effectief in te zetten. Onze experts delen waardevolle inzichten, best practices en direct toepasbare tips om jouw organisatie te laten excelleren in de datagedreven wereld.
Voor wie is dit event?
Ben jij de drijvende kracht achter digitale transformatie in jouw organisatie? Sta je voor grote veranderingen en zoek je praktische tools die direct inzetbaar zijn? Ons seminar op 30 januari 2024 is speciaal ontworpen voor managers en besluitvormers die willen excelleren in de wereld van AI, analytics en data. Ontdek hoe je deze krachten kunt inzetten voor een tastbare impact in jouw organisatie. Ook professionals die hun kennis willen vergroten op deze baanbrekende onderwerpen zijn van harte welkom. We bieden inzichten en praktische tools die jou een voorsprong geven.
Wat kun je verwachten?
Vier inspirerende sprekers nemen je mee in het succes van datagedreven werken. Ze delen waardevolle inzichten en praktische tips om je op weg te helpen. Dit evenement biedt ook uitstekende mogelijkheden om te netwerken en ervaringen uit te wisselen.
Programma en locatie
Het programma is samengesteld uit een openingssessie en drie sprekerssessies.
Natuurlijk sluiten we de dag gezamelijk af met een hapje en drankje.
Datum: 30 januari 2024
Locatie: Royal HaskoningDHV, Amersfoort (Laan 1914 35, 3818 EX)
Noor Veenhoven,
Program manager energy & circularity
at Amsterdam InChange,
posted
Highlights Data Dilemma's: Kijken onder de grond en samenwerken erboven
English version below
We zien het misschien niet, maar de ondergrond ligt vol met assets en is voortdurend in beweging. Er liggen elektriciteitskabels, gasleidingen, riolering, stadswarmte, glasvezel, en nog veel meer, die constant moeten worden onderhouden, verwijderd, of bijgelegd. De ambities van Nederland voor de energietransitie, snel dataverkeer, mobiliteitsoplossingen, circulaire economie en klimaatadaptie, leggen alleen nog maar meer druk op de schaarse ondergrond. Goed inzicht hebben in wat er precies onder de grond ligt en goede samenwerking tussen de verschillende partijen die de grond in moeten is daarom essentieel.
Tijdens de Data Dilemma’s evenementen van Amsterdam Smart City verkennen we de mogelijkheden voor het gebruik van data en nieuwe technologieën om stedelijke en maatschappelijke uitdagingen aan te pakken, met een focus op verantwoorde digitalisering. Het doel is om data te gebruiken om steden veiliger, schoner en toegankelijker te maken.
In deze editie van Data Dilemma’s, bespraken we het dilemma van de ondergrond: Hoe zorg je dat de data van de ondergrond klopt met de werkelijkheid en hoe kunnen de partijen die de grond in moeten beter samenwerken. De sprekers van dit evenement waren Ceciel Kempers (Alliander), Marco Scheffers (Gemeente Amsterdam) en Vincent van Mierlo (Eurofiber Nederland) die ieder hun tools en dilemma’s deelden als zij met hun organisatie de grond in gaan.
Het Scan de Sleuf project - Ceciel Kempers
Ceciel Kempers, bedrijfsontwikkelaar bij Alliander, vertelde over hun ‘Scan de sleuf’ project, waarbij ze een 3D scan maken van open werksleuven om inzichtelijk te maken waar alle assets precies liggen. Bij Alliander levert de huidige aanpak van schetsverwerkingen op dit moment nog veel problemen op. De doorlooptijd van assetregistratie is op het moment 550 dagen. Dit zorgt ervoor dat de data over de ondergrond soms flink achterloopt op de werkelijkheid wat weer kan leiden tot graafschade, gevaarlijke situaties en veel uren die gaan naar het zoeken van assets.
Volgens Ceciel moet de buitensituatie leidend gemaakt worden door middel van een 3D scan, een Scan de Sleuf, waar er letterlijk een scan gemaakt wordt van de werksleuf in de grond wanneer deze open ligt. Dit kan gewoon met een tablet of smartphone worden gedaan en de technologie zal beschikbaar zijn voor iedereen die de grond in moet. Als de grond dan ooit weer open moet, kan er op de 3D scan precies gezien worden waar de kabels zich bevinden. Dit zorgt er op de korte termijn voor dat er minder discussies ontstaan met aannemers over aangelegd werk en dat er minder liggingsregistraties worden afgekeurd. Later zal het ook de registratie versnellen en de kwaliteit van liggingsdata verbeteren. Op de lange termijn zullen ook graafschade en gevaarlijke situaties afnemen.
Een ander groot voordeel van 3D data is dat afstanden nauwkeurig ingemeten kunnen worden door middel van pixelafstanden. Daarnaast kan er een kaart laag, die de kabels en leidingen in de ondergrond weergeven, op de werkelijkheid gelegd worden aan de hand van geo-referentie.
De eindvisie van het Scan de Sleuf project is om een landelijke 3D-database van de ondergrondse situatie te maken: De ‘Understreetview’ van Nederland.
Data samenbrengen in de Digital Twin van de ondergrond - Marco Scheffers
Bij de Gemeente Amsterdam is er vanuit de ambtenaren een werkgroep ondergrond ontstaan, vertelde Marco Scheffers, data-adviseur ondergrond en geo-informatie bij de Gemeente Amsterdam. Volgens hen moest er meer gedaan worden aan de ondergrond in Amsterdam, de huidige kwaliteit van informatie over de ondergrond is onvoldoende om de huidige en toekomstige verdeling van ruimte inzichtelijk te maken. Daarom is er besloten te gaan werken met regie op de ondergrond.
De eerste stap is het vormen van het Datafundament ondergrond, een digitale basis binnen de Amsterdamse Digital Twin. Het bestaat uit relevante ondergrondgegevens van systemen en fenomenen die vitaal zijn voor de stad, denk hierbij aan kabels, leidingen, historische assets, funderingen van gebouwen en fysische eigenschappen van de bodem. Uiteindelijk is het plan om ook 3D informatie te verschaffen en te bouwen aan een Digital Twin van de ondergrond.
Er wordt nu gebouwd aan data over de ondergrond op het platform data.amsterdam.nl. Niet alle data over de ondergrond is openbaar, de KLIC data (Kabels en Leidingen Informatie Centrum) is alleen toegankelijk voor bevoegden. De Digital Twin van Amsterdam is te zien op 3d.amsterdam.nl.
Een dynamische ondergrond zonder z-coördinaat - Vincent van Mierlo
De laatste spreker was Vincent van Mierlo, strategisch adviseur bij Eurofiber Nederland. Eurofiber is gespecialiseerd in het aanleggen van glasvezelaansluitingen, ze werken dus met vitale infrastructuur. Dit betekent dat als deze processen uitvallen of verstoord worden, er snelle reparaties vereist zijn. Dit leidt met hun 60.000 kilometer aan glasvezelkabel tot 500 handelingen per week.
Bij 3D visualisaties van de bovengrond wordt het meteen duidelijk of de data klopt, maar bij 3D visualisaties van de ondergrond kun je niet makkelijk zien of de data correct is. Dit kan een risico op schade aan netwerken veroorzaken omdat er wordt uitgegaan van theoretische data. De leggegevens zijn niet per se hetzelfde zijn als de liggegevens (en dat die termen maar één letter van elkaar verschillen leidt ook tot verwarring). De ondergrond blijft dynamisch waardoor ook kabels en leidingen in de werkelijkheid anders gepositioneerd kunnen zijn dan verwacht. In principe liggen glasvezelkabels op 60 cm diepte maar dat is lang niet altijd het geval. Daarom zou 3D visualisaties kunnen helpen met het verschaffen van niet alleen de X en Y coördinaten, maar ook de Z-coördinaten (diepte).
Volgens Vincent is het belangrijk om een geharmoniseerde werkwijze van 3D inmeten in te stellen die op landelijk niveau wordt vastgelegd. Daarnaast moet er eenzelfde taal/jargon worden gekozen. Want als we niet dezelfde taal spreken, dan wordt het onmogelijk om samen te werken.
We willen graag onze sprekers bedanken voor de interessante presentaties en het publiek voor de waardevolle discussie. De dilemma’s in de ondergrond brengen een hoop vragen met zich mee waar we graag met het Amsterdam Smart City netwerk aan verder werken.
Vervolg: We gaan door met het vraagstuk: Hoe kijken we onder de grond zonder te graven? Waarbij we met partijen die de grond in moeten, en partijen met slimme technologische oplossingen bespreken wat er allemaal mogelijk is om te kijken onder de grond zonder te graven. Heb je ook te maken met de vraagstuk, of kun je helpen met het vinden van een oplossing? Neem dan contact op met noor@amsterdamsmartcity.com.
Data Dilemmas: Looking Below Ground and Collaborating Above
We may not see it, but the underground is filled with assets and is constantly in motion. It contains electricity cables, gas pipelines, sewage systems, district heating, fibre optics, and much more, all requiring regular maintenance, removal, or expansion. The ambitions of the Netherlands for the energy transition, fast data traffic, mobility solutions, circular economy, and climate adaptation only add more pressure to the already limited underground space. Having a clear understanding of what lies beneath the ground and fostering effective collaboration among the various stakeholders involved in underground activities is essential.
During Data Dilemma's, we explore the possibilities for using data and new technologies to address urban and societal challenges, with a focus on responsible digitalization. The goal is to use data to make cities more safe, clean and accessible.
In this edition of Data Dilemmas, we discussed the dilemma of the underground: How to ensure that underground data matches reality and how the parties involved in underground activities can collaborate more effectively. The speakers for this event were Ceciel Kempers (Alliander), Marco Scheffers (City of Amsterdam), and Vincent van Mierlo (Eurofiber Netherlands), each sharing their tools and dilemmas when working beneath the ground.
The Scan the Trench Project - Ceciel Kempers
Ceciel Kempers, a business developer at Alliander, shared insights into their "Scan the Trench" project, where they create a 3D scan of open work trenches to make the exact locations of all assets visible. Alliander's current approach to make a work sketch of the situation is causing significant problems. The asset registration process takes 550 days at present, resulting in outdated data about what's underground, which can lead to excavation damage, hazardous situations, and significant hours spent searching for assets.
According to Ceciel, the outdoor situation should be the guiding force through a 3D scan, a "Scan the Trench," where a scan is created of the open trench in the ground. This can be done with a tablet or smartphone and will be available to anyone who needs to work in the underground. If the ground ever needs to be reopened, the 3D scan can precisely show the location of the assets, reducing disputes with contractors over completed work and rejected location registrations in the short term. In the long term, it will also accelerate asset registration and enhance the quality of location data, reducing excavation damage and dangerous situations.
Another significant advantage of 3D data is the ability to measure distances accurately using pixel distances. Additionally, a map layer depicting underground cables and pipelines can be overlaid on reality through geo-referencing.
The vision for the future of the Scan the Trench project is to create a national 3D database of the underground situation: the "Understreetview" of the Netherlands.
Bringing Data Together in the Digital Twin of the Underground - Marco Scheffers
At the municipality of Amsterdam, a group dedicated to the underground was formed by civil servants, as explained by Marco Scheffers, a data advisor specializing in the underground and geoinformation at the City of Amsterdam. They believe that more attention should be given to the underground in Amsterdam, as the current quality of information about the underground is insufficient to make the current and future spatial distribution transparent. Therefore, a decision was made to work on managing the underground.
The first step involves establishing the Data Foundation for the underground, a digital base within Amsterdam's Digital Twin. It comprises relevant underground data from systems and phenomena vital to the city, such as cables, pipelines, historical assets, building foundations, and soil properties. The ultimate plan is to provide 3D information and build a Digital Twin of the underground. Data about the underground is currently being developed on the platform data.amsterdam.nl. Not all underground data is publicly accessible; the KLIC data (Cables and Pipelines Information Center) is only accessible to authorized personnel. The Digital Twin of Amsterdam can be viewed at 3d.amsterdam.nl.
A Dynamic Underground without Z-Coordinates - Vincent van Mierlo
The final speaker was Vincent van Mierlo, a strategic advisor at Eurofiber Netherlands. Eurofiber specializes in installing fiber optic connections, so they work with critical infrastructure. This means that when these processes fail or are disrupted, quick repairs are required, which results in around 500 actions per week with their network of 60,000 kilometres of fibre optic cables.
With 3D visualizations of the surface, it's immediately clear whether the data is accurate. However, with 3D visualizations of the underground, it's not easy to determine the correctness of the data. This can pose a risk of network damage because it relies on theoretical data. The laying data may not necessarily match the lying locations, and the similarity of the terms "laying" and "lying" also leads to confusion. The underground remains dynamic, and cables and pipelines can be positioned differently in reality than expected. In principle, fibre optic cables are supposed to be at a depth of 60 cm, but this is not always the case. Therefore, 3D visualizations could help provide not only X and Y coordinates but also Z-coordinates (depth).
According to Vincent, it is important to establish a harmonized approach to 3D mapping at a national level. Additionally, a common language/jargon should be adopted because if we don't speak the same language, collaboration becomes impossible.
We would like to thank our speakers for their informative presentations and the audience for their valuable discussions. The underground dilemmas bring forth numerous questions that we are eager to continue addressing with the Amsterdam Smart City network.
Next Steps: We will proceed with the question: How can we look beneath the ground without excavation? We will discuss with parties involved in underground activities and those with smart technological solutions to explore what is possible in investigating beneath the ground. If you are dealing with similar questions or can assist in finding a solution, please contact noor@amsterdamsmartcity.com.
Noor Veenhoven,
Program manager energy & circularity
at Amsterdam InChange,
posted
Technologies that allow for looking underground without digging
The ground is full of cables, pipes, and other assets but we don’t always know exactly where they are located. Digging is the most common practice to look for assets, however, this has many negative impacts. It can lead to damage to assets, it costs time and money to dig, and it is often an inconvenience to the direct surroundings.
Therefore, it would be extremely convenient if we could find methods to locate assets without having to dig. We are looking for start-ups, research groups, and knowledge institutions that have developed or can develop a technology that can scan, detect, or sense, underground assets without digging.
Are you the person we are looking for, or do you know the person or organisation we are looking for? Please let us know by sending a message to noor@amsterdamsmartcity.com or leaving a comment below.
Stay up to date
Get notified about new updates, opportunities or events that match your interests.
Set up preferences

