Stay in the know on all smart updates of your favorite topics.
Demoday #27: What is ethical mobile software for your phone?
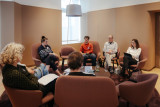
We depend heavily on Big Tech companies like Google, Meta, Apple, Amazon, and more. And with your smartphone, there is no escaping them. Even if you don’t use social media, and use anti-tracking software, some of your data will still be shared and sold. This can make you feel pretty uncomfortable. Especially, since most of these tech companies are in the USA and China. This is why, in this session, we worked on the question: Is it possible to develop mobile software which is ethical and functional?
Danny Lämmerhirt from Waag Futurelab works on the MOBIFREE project. This project aims to change the development and use of mobile software in Europe by citizens, businesses, non-profits and governments. In doing so, they want to support the emerging movement for ethical mobile software consisting of organisations that adhere to European values such as openness, privacy, digital sovereignty, fairness, collaboration, sustainability, and inclusivity.
In this session, Danny introduced us to the smartphone they are working on. This smartphone has its hardware from Fairphone (an ethically produced smartphone) and uses a privacy-friendly operating system: Murena. This operating system is an Android fork that doesn’t come with standard tracking software. On top of that, it has an app store with only ethical apps and is connected to an ethical European cloud.
Outcomes
We discussed with the group what values we found most important in an ethical mobile phone when using it for work. The values that were deemed most important by the group were:
- Autonomy: A smartphone allows working wherever and whenever you want. It is an incredibly powerful tool that you can use for so many different things, and it fits in your pocket.
- Independency: We’ve become incredibly dependent on our smartphones. When you lose your phone, you no longer have your money, your public transport card, a map to find the way, etc. On the other hand, this also means that you don’t need to travel with a bag full of tools every time you leave the house.
- Privacy: Constantly being tracked has become normal, but that doesn't mean we’re happy with it. Right now, you don’t have a choice. It would be nice to have a choice, to either pay with your data, or with money.
- User-friendliness: An ethical and privacy-friendly smartphone sounds great, but it also means that you can no longer use many of the apps that you’re used to. Will it still be practical to use? And will it be intuitive? We are all used to a certain way of working and are hesitant to change.
This discussion was definitely food for thought. We all want a more ethical phone, but are not willing to sacrifice much in return…
Are you interested in trying out this ethical smartphone? The MOBIFREE project is currently looking for people who can test this smartphone. They are looking for young adults, civil servants, mobile software developers, and professionals working in humanitarian organisations.
<strong>Would you like to participate, or do you have any questions about this project? Please contact Noor at noor@amsterdaminchange.com. Special thanks to Danny Lämmerhirt for this interesting session.</strong>
Dutch Applied AI Award 2024 naar Sturgeon, UMC Utrecht en Oncode Institute
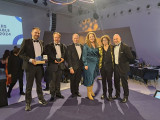
Sturgeon, het AI-initiatief van UMC Utrecht en Oncode Institute is dit jaar de winnaar van de Dutch Applied AI Award 2024. Naast deze award heeft de AI-toepassing ook de Computable Award in de categorie ‘Zorgproject’ gewonnen.
In verkorte tijd het type hersentumor bepalen met behulp van AI
Dankzij de inzet van AI kunnen neurochirurgen sneller bepalen met welk type hersentumor zij te maken hebben. De technologie vermindert de tijd die nodig is voor het stellen van een diagnose, van dagen naar ongeveer drie kwartier. Een behandelplan kan hierdoor sneller worden opgesteld. De technologie is ontwikkeld door de onderzoeksgroep van biomedicus Jeroen de Ridder van UMC Utrecht en Oncode Institute. Het algoritme dat het type hersentumor moet bepalen is getraind op miljoenen onvolledige datavoorbeelden van verschillende typen tumoren. Sturgeon is publiek beschikbaar en het wordt inmiddels ook ingezet in het Máxima Kinderziekenhuis voor het diagnosticeren van kinderkanker.
Jury prijst complexiteit van de technologie
De jury van de Dutch Applied AI Award heeft bewondering voor de toepassing. “Dit jaar een AI-toepassing in de medische sector, in het bijzonder voor de snelle herkenning van hersentumoren, wat voor zowel patiënt als chirurg een enorme impact heeft. Ze waren met de technologie van Sturgeon in staat om een model te ontwikkelen dat uit een minimale hoeveelheid pixels een accurate diagnose kan stellen, en dat in ongeveer drie kwartier tijd”. Aldus Nanda Piersma, jurylid van de Dutch Applied AI Award.
Het is de vijfde keer dat de Dutch Applied AI Award werd uitgereikt. Dit jaar in de jury:
· Nanda Piersma (Hogeschool van Amsterdam)
· Anouk Dutreé (De Dataloog & UbiOps)
· Omar Niamut (Hogeschool van Amsterdam & TNO)
· Maaike Harbers (Hogeschool Rotterdam)
· Jann de Waal (Topsector Creatieve Industrie)
· Sander Hulsman (Jaarbeurs Utrecht)
Over de Dutch Applied AI Award
Red Light District Relocation: What do you think? 🤷🤦♀️
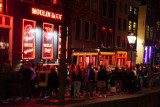
Amsterdam is set to relocate its iconic Red Light District from De Wallen to Europaboulevard, marking a significant shift in the city's approach to sex work and urban development.
This move aims to create a more structured and safe environment for sex workers while addressing concerns about over-tourism and its impact on local communities. We analyzed available data online to understand the hottest topics from affected groups.
<strong>See data insights on Playground Journal. Or listen to a short 5-minute podcast on this here.</strong>
This is your opportunity to engage in the conversation. Your insights and opinions matter in shaping a future that respects the city’s rich history while addressing the challenges and hopes of its diverse inhabitants.
The significance of this relocation lies in its potential to reshape Amsterdam's cultural and social landscape. It reflects the city's commitment to balancing the needs of residents, tourists, and sex workers, ensuring that the new Erotic Centre aligns with contemporary values while preserving the district's historical essence.
As this transformation unfolds, community input is vital. Residents, business owners, and other stakeholders are encouraged to contribute their thoughts and ideas to help shape the future of the new Red Light District. Your insights can influence the new facility's design, amenities, and safety features.
While communities can influence many aspects—such as building design, types of amenities, and community engagement processes—certain elements are fixed. The location of the new RLD has already been determined, as are existing laws and regulations governing sex work. Additionally, the core concept of the Erotic Centre and project timelines remain unchanged.
Let’s ensure that the new Red Light District reflects the values and aspirations of all who call Amsterdam home. Your voice matters!
Data Dilemmas Recap: Using Data and AI for an Accessible Amsterdam
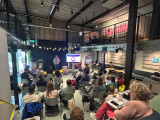
On September 26th, our community gathered in the AHK Culture Club at Marineterrein Amsterdam for our Datadilemma’s series. This edition focused on the use of Data and AI to create a more accessible Amsterdam. This article presents some of the key highlights and insights from the afternoon.
Together with the three speakers, Vishruth Krishnan, Hans Voerknecht, Michiel Bontenbal, and our audience we discussed how data and AI can help make our city more accessible for all. Which dilemma’s do we encounter when we use new technologies for an accessible city? How can data help to get more understanding of unequal access to mobility in the country? And what about sounds and noise pollution; how can data help make te city more livable?
What the three speakers had in common; a personal motivation to get away from the surface and dive deeper into the data, attempting to get closer to people’s experiences and perceptions. From an ordinary routeplanner, to one paying specific attention to challenges for people in weelchairs. From generic accesibility data for the region, to data highlighting the unequal distribution of access to mobility. And from recording noise levels, to measuring and classifying all different sounds in urban settings. In the paragraphs below, I will delve deeper into the different speakers and their topics.
Visruth Krishnan – Personalized Route Planner for People in a Wheelchair
To help individuals with limited mobility navigate the city more easily, the city’s innovation department has developed a prototype route planning tool. This route planner maps out the most accessible routes based on personal needs, considering preferences like maximum curb height at crossings, minimum sidewalk width, and whether to prioritize sidewalks or bike paths.
Visruth Krishnan, Data Scientist at the Innovation Department of the Municipality of Amsterdam, explained how data helps facilitate travel from point A to point B. However, to ensure route planning tools address the challenges faced by wheelchair users, we must feed these systems with data drawn from real-world experiences. A person’s journey might present specific challenges, such as detours, improperly parked bicycles, slopes, and narrow footpaths.
Working with a group of wheelchair users, Visruth studied the obstacles and experiences they encountered on their routes. This research generated precise data to feed the route planner, enabling it to provide personalized route suggestions that account for each individual’s freedom of movement.
Visruth presented several dilemmas encountered during the project:
- Subjectivity in the data: How busy is a sidewalk or intersection perceived to be? Are cyclists at a certain point fast and aggressive, or is that just a feeling?
- Minimal vs. comprehensive data collection: How much data should be gathered? While more data might provide deeper insights, it could also increase privacy risks.
- Accurate vs. timely data: Timely data may not always be accurate, and accurate data may not always be available in time for critical decision-making. Consider issues like illegally parked bikes, construction work, and terraces that vary in size and location depending on the season.
- Transparency vs. complexity: How transparent should data-driven processes be, especially when the algorithms or analytics behind them are complex? AI is often seen as a "black box"—people don’t understand how it works or how data is processed, which can lead to less trust from the start.
To address these challenges, Visruth and his team maintain an ongoing dialogue with the target audience. It’s an iterative process, and they keep the ‘human in the loop.’ The prototype is now ready, and hopefully, it can be further developed!
Hans Voerknecht – Unequal Accesibility and Data to Support The Narrative
Hans Voerknecht, strategist for sustainable accessibility at Een Nieuwe Kijk, presented the Integrated Perspective on Accessibility method, which he developed to get a deeper understanding of people’s accessibility. This method assists in collecting data and analyzing the severity of current inequalities and the effects of policy measures. The method has already been applied in nearly twenty projects, including four in the Amsterdam region, such as the Multimodal Future Vision of the Metropoolregio Amsterdam (MRA).
IKOB stands for "Integrale Kijk Op Bereikbaarheid" (Integrated Perspective/view on Accessibility). IKOB examines the travel time and costs that people face to reach their workplace by bike, car, or public transport and it visualizes how many jobs people can access from a specific area.
IKOB uses 'distance decay curves<strong>,'</strong> meaning that jobs located closer are given more weight than those further away. Travel time and costs are adjusted depending on the target group. Factors considered include income, access to a car, travel cost reimbursement, public transport options, and preference for a mode of transport (car, public transport, or bike). For people with a lower income, costs weigh more heavily than for those with higher incomes.
Throughout his talk, Hans discussed how data can be used to support a narrative, either consciously or unconsciously. Regional research on the state of mobility can quickly paint a positive picture if you're working with averages and fail to examine differences between people. There are groups that experience less access to mobility, and for whom this issue carries more weight due to financial constraints. The way data is researched and how deeply you investigate determines to what extent this group and their challenges are brought into focus.
One of the dilemmas Hans mentioned was the fact that poor accessibility is a personal experience. It’s subjective, and there can be a lot behind it. Regardless of the detail and quality of your data, you can never be completely sure if it truly reflects the human experience it’s supposed to represent.
Michiel Bontenbal – The Urban Sounds Sensor
Our third and final speaker discussed sounds and noise pollution in an urban environment. It may not seem to immediately fit with the rest of the speakers, but urban sound is also important to consider when creating an accessible and liveable city. Michiel Bontenbal, lecturer in business and IT courses at the Amsterdam University of Applied Sciences, told us more about the Urban Sounds sensor, developed in collaboration with the volunteer organization Sensemakers. He explained us more about the challenges they face with this AI-driven solution and raised some dilemmas in his work.
The Urban Sounds Sensor project was developed in response to the need for evidence of nighttime noise disturbances. It was crucial to be able to distinguish between different types of sounds, such as music, mopeds, alarms, doors, car noises, and honking.
Together with the volunteers from Sensemakers, Michiel designed the sensor in such a way that the recorded sounds are neither stored nor released. The microphone registers the sound, and the algorithm in the sensor immediately categorizes it within the device. This approach ensures privacy by design.
Training the sensor is still an ongoing process. Achieving high accuracy is challenging, as even humans sometimes have trouble identifying certain sounds. And, while measuring noise disturbances is definitely getting more attention in the city now. However, this specific method of distinguishing between sound categories is still lagging behind in both development and interest from government authorities.
Michiel concluded his presentation by discussing his dilemmas with the audience. One of his dilemmas, as expected, was about placing microphones in public spaces; how desirable is that, really? It's important to talk about ethics and privacy when measuring in public spaces, especially with a sound sensor that isn’t visible. His second point focused on the experience of city sounds. How you perceive sounds depends on personal experiences and preferences. Some people enjoy urban sounds, like the noise of a tram or ringing bike bells. People may have associations with certain sounds that determine whether they find them annoying, don't even notice them, or actually enjoy them. This is a factor that a sound sensor and the data it collects have difficulty accounting for.
Panel Discussion
After the presentations, we brought the speakers together for a panel discussion. Led by Chris de Veer, programme manager Mobility at Amsterdam InChange, there was an engaging conversation with the audience. To wrap things up, I’d like to highlight three key statements made by the speakers in response to some critical questions from the audience:
- "We often try to objectify the world with data, but there is no objective truth. However, diving deep into data can give you a better and more diverse understanding of an issue or region." – Hans
- "Data is always messy. If the data we input is messy, the outcome will also be messy. Garbage in, garbage out." – Michiel
- “The Route Planner method and platform could be of great use in gaining a better overview of building accessibility throughout the city.” - Visruth
Thanks to the speakers for their stories and to the audience for the lively discussions afterwards. Want to join us for our next Data Dilemmas event? The next edition of this series of open events will be announced soon. We’re also always open to new themes and topics for this series; we’re curious to hear about the data dilemmas you encounter in your work!
Wie maakt kans op de Dutch Applied AI Award 2024?

Na topoverleg van de jury maken drie initiatieven kans op de Dutch Applied AI Award. Het is voor de vijfde keer op rij dat deze prijs tijdens de Computable Awards in november wordt uitgereikt. Met de award belonen het Centre of Expertise Applied AI van de Hogeschool van Amsterdam, ICT-platform Computable en podcast De Dataloog een vernieuwend initiatief op het gebied van toegepaste Artificiële Intelligentie.
We feliciteren de volgende genomineerden:
Wie er uiteindelijk met de award vandoor gaat, wordt bekend op woensdagavond 27 november 2024 tijdens de uitreiking van de Computable Awards in Utrecht. De jury - bestaande uit zes experts op het gebied van Applied AI - heeft de genomineerden geselecteerd op drie criteria:
Applied AI - in hoeverre is de oplossing al geïmplementeerd, wordt het gebruikt door de beoogde doelgroep en hoe groot is het aantal (potentiële) klanten/het aantal mensen dat met deze innovatie direct of indirect wordt geholpen.
Uniekheid - in hoeverre is de innovatie de enige in haar soort, is het nooit eerder op de markt gebracht en kan het doel van de innovatie niet op een andere manier worden behaald.
Responsible AI (transparantie, privacy, fairness, etc.) - in hoeverre is het ontworpen of gebruikte AI-algoritme transparant. Stelt het de gebruiker in staat om verantwoording af te leggen en duidelijk te zijn over de factoren die de algoritmische beslissingen beïnvloeden.
Dit jaar in de jury:
Nanda Piersma | Hogeschool van Amsterdam | Wetenschappelijk directeur Centre of Expertise Applied AI
Jurjen Helmus | Hogeschool van Amsterdam | Coördinator Smart Asset Management Lab | Eigenaar De Dataloog
Omar Niamut | TNO | Director of Science
Maaike Harbers | Hogeschool Rotterdam | Lector AI & Society
Jann de Waal | Topsector Creatieve Industrie | Voorzitter | Oprichter INFO
Sander Hulsman | Jaarbeurs Utrecht | Chief Digital Content
Data Dilemma's verslag: De Voedseltransitie
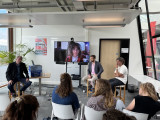
Op 30 mei nodigden we onze community uit bij AMS Institute op het Marineterrein voor een Data Dilemma’s event over de Voedseltransitie. Het ging deze middag over technische dilemma’s rond data en de verduurzaming van voedselketens, en; wat is nou echt lokaal voedsel?
Data Commons: Een digitaal gemeenschapsgoed met een gezamenlijk doel
Jan Wester, directeur van Big Data Value Center, vertelde ons meer over het project ‘Data Value Center Agri & Food Korte Keten’. Aanleiding voor dit project is de transitie naar een duurzamer voedselsysteem waarbij digitalisering en data een belangrijke rol spelen. Er is de wens dat relatief meer voeding uit de regio komt (in plaats van langere ketens), dat er meer transparantie en efficiëntie is in ketensamenwerking en dat er meer informatie wordt vastgelegd over productie en herkomst (denk aan True Pricing). Dit vraagt om een neutraal precompetitief platform. Dit platform kan je zien als een zogenaamde Data Commons: een digitaal gemeenschapsgoed waarin je samen afspraken maakt over het delen van data; wat deel je, met wie, en wat is het gezamenlijke doel ermee?
De Agrifood Data Common is een veilige data-deel omgeving/marktplaats/dashboard, met verschillende gebruikersgroepen. Ondernemers kunnen hiermee bijvoorbeeld markten transparanter maken, ketensamenwerking verbeteren en meervoudige verdienmodellen creëren. Overheden kunnen gebruik maken van de omgeving voor meer evidence-based beleid en het monitoren van impact. Ten slotte kunnen kennisinstellingen gebruik maken van het platform voor de opbouw van referentiedata en het delen van data uit experimenten en fieldlabs. Belangrijk is dat de verschillende partijen vertrouwen met- en in elkaar opbouwen om dit samen te laten werken.
De cateringketen van de Hogeschool van Amsterdam als case
DVC Agri & Food is samen met partners cases aan het bouwen die het nut en belang van dit digitale gemeenschapsgoed in de praktijk tonen. Kees Willem Rademakers van de Hogeschool van Amsterdam vertelde ons meer over het ‘Food Governance 2.0’ project met betrekking op hun eigen cateringketen.
De HvA wilt zich actiever afvragen wat ze van (hun) voedsel vinden en hoe ze een nieuwe rol kunnen spelen in hun eigen lokale voedselsysteem. Ze kijken naar factoren als gezondheid, biodiversiteit, betaalbaarheid en energiegebruik. Als je hier kritisch naar wilt kijken blijkt hoe moeilijk het is om te onderzoeken waar kantineproducten precies vandaan komen. De precieze oorsprong, de reizen die het afgelegd heeft, de arbeidsomstandigheden; het zijn onderdelen waar je als afnemer grip op- of in ieder geval een beeld van wilt hebben. Er is nu een ongelijke machtsverdeling waarbij de leverancier meer data over de keten bezit en dit gebruikt als verdienmodel.
Binnen een keten die digitaal en transparant is georganiseerd, kan de HvA zien wat er nu gebeurt, kan er onderhandeld worden, en kunnen ze samen gaan hervormen waar ze naartoe willen. Het is belangrijk om daarom de governance structuren over voedselketens en de informatiestructuren daarbinnen opnieuw vorm te geven met elkaar. Jan Wester en Kees Willem Rademakers concluderen samen dat deze hervorming vooral zit in wederkerigheid en bereidheid om meer data met elkaar te delen, en de digitale platformen die dit mogelijk maken.
Flevo Campus: Samen werken aan het stedelijk voedselsysteem van de toekomst
Lenno Munnikes vertelde ons meer over lopende initiatieven bij de Flevo Campus. Een organisatie waar onderzoek, onderwijs, ondernemerschap en overheden samenkomen om samen te werken aan het stedelijke voedselsysteem van de toekomst. Hier verbinden ze economische, maatschappelijke en kennis-vraagstukken op het gebied van een duurzame voedseleconomie en een gezonde voedselomgeving.
In een project rond ‘de supermarkt van de toekomst’ zijn ze aan het experimenteren met het verbreden van het assortiment van lokale producten in de schappen. Als je een deel van een supermarkt bijvoorbeeld reserveert voor lokale ondernemers, ontstaat er al sneller een match tussen lokale consumenten en lokale producenten. Ook wordt er gekeken hoe je stadstuinderijen kan ontwikkelen met een mix van verschillende functies. Naast voedselzekerheid, kan zo’n plek ook een belangrijke educatiefunctie vervullen voor kinderen en jongeren in de buurt, kan er onderzoek plaatsvinden, kunnen er nieuwe verdienmodellen worden uitgeprobeerd, en kan de tuin gekoppeld worden aan een zorgcentrum in de buurt.
Ten slotte vertelde Lenno over hun projecten in de zogenaamde Labs. Hier experimenteren ze op kleine schaal om ons aan het denken te zetten over ons voedselsysteem. Een bekend voorbeeld is het hergebruiken van de ‘reststromen’ van de kip. Na slachting wordt zo’n 70% van het dier als reststroom verscheept naar andere continenten. Maar wat als je nou alles van de kip verwerkt? Hoe kan je omgaan met onderdelen van een dier dat je niet opeet? Met deze vragen gingen ze aan de slag en creëerden ze bijvoorbeeld een tasje van de huid, zeep van het vet en keramiek van de botten. Een experiment als dit kan op kleine schaal worden uitgevoerd, maar via nieuwskanalen veel mensen bereiken en aan het denken zetten over ons voedselsysteem.
Onderzoek naar de klimaatimpact van een voedselketen; van verantwoording naar nieuwsgierigheid
Leen Felix, adviseur Agrifood en Biodiversiteit bij Metabolic, nam ons mee in het proces waarmee ze bedrijven adviseert over de duurzaamheid van hun voedselketen. Het begint simpel, bij de ingrediëntenlijst van een product. In plaats van de locatie van de leverancier, moet je echt op zoek naar de productielocatie; het land van herkomst per ingrediënt. De impact van voedselproductie hangt namelijk af van de combinatie van het productieproces en de productielocatie. Maten van landgebruik, bodemtransformatie en uitstoot van broeikasgassen, bijvoorbeeld, hebben ieder een effect op de natuurlijke omgeving. De ruimtelijke context bepaald hoe schadelijk deze processen zijn voor de aarde en het klimaat. Je kan hierbij denken aan de volgende voorbeelden: Het verbouwen van soja, waarbij veel land voor nodig is, is schadelijker als er regenwoud in Brazilië voor wordt gekapt. Het transformeren en homogeniseren van de bodem is schadelijker voor het klimaat, als dit gebeurt op een plek waar voorheen een relatief hoge mate van biodiversiteit aanwezig is. Water-intensieve productieprocessen hebben meer impact op mens en natuur als het plaatsvind op locaties waar water schaars is.
Metabolic koppelt daarom ruimtelijke context aan productieprocessen. Via scores is te zien hoe de negatieve impact van productieprocessen nog sterker is in ‘gebieden met een gevoeligheid’. Dit legt de complexiteit vast waar je in mondiaal voedselsysteem mee te maken hebt. Hoe meer ingrediënten in een product, hoe meer productielocaties, hoe meer factoren die de klimaatimpact beïnvloeden. Het is voor Leen als analist en adviseur de balans zoeken tussen het weergeven van álle data en de complexiteit van de keten, en het adviseren met een platgeslagen verhaal waar de opdrachtgever soms naar op zoek is. Je wilt een bedrijf niet verlammen met de data, maar ze ook wel gericht handvatten geven om bijvoorbeeld risicolocaties en ingrediënten te vermijden.
Leen sluit af met een drietal lessen voor het publiek:
- Perfecte data bestaat niet, en dat is niet eens zo erg: focus op het verhaal wat je ermee kan en wilt overbrengen.
- Van verantwoording naar nieuwsgierigheid: Je kan dus niet 100% verantwoorden en berekenen, maar je moet wel een nieuwsgierige houding tonen over bijvoorbeeld alle bijkomende milieulasten en context risico’s.
- Geen top 10 maar systeemdenken: Duurzaamheid als een simpel thema laten vallen, het is geen top 10 maar denk in systeem met contrasten, schaal, complexiteit, ruilfuncties. ‘One size fits all’ oplossingen werken niet.
Dank aan de sprekers voor hun verhalen en het publiek voor de levendige discussies na afloop. Wil je bij onze volgende Data Dilemma's zijn? De volgende editie van deze serie open events vindt plaats op 16 juli. Ook staan we altijd open voor nieuwe thema’s en onderwerpen voor deze serie; we zijn benieuwd wat voor data dilemma’s jij mee in aanraking komt bij je werk!
😀Resultaten - Is betrokkenheid van de gemeenschap de moeite waard? 😀

We hebben uiteenlopende en interessante reacties ontvangen van stedenbouwkundigen, architecten en gemeenten. Als u wilt weten wat andere professionals denken, vul dan deze enquête in met uw e-mailadres en wij delen de inzichten met u.
Bedankt! 😀
Follow Playground on LinkedIn
We've received varied and interesting responses from urban developers, architects, and municipalities. If you want to know what other professionals think, please fill out this survey with your email, and we will share the insights with you.
Thank you! 😀
Amsterdamse ziekenhuizen gaan data delen
Amsterdam UMC, OLVG en het Antoni van Leeuwenhoek (AVL) gaan elkaars medische data gepseudonimiseerd hergebruiken in Health Data Space Amsterdam.
HDSA is een geheel nieuwe, regionale zorgdata-infrastructuur. Deze ondersteunt patiëntenzorg en medisch wetenschappelijk onderzoek naar gezondheid en preventie. Met als doel: gezondheidsverschillen in de regio te verkleinen en de gezondheidszorg toegankelijk te houden.
Het initiatief van de drie Amsterdamse ziekenhuizen komt voort uit een bredere samenwerking met de Universiteit van Amsterdam, Vrije Universiteit Amsterdam, Gemeente Amsterdam, Amsterdam Economic Board en Philips. Verder trekken de ziekenhuizen nauw op met Amsterdam AI, het Amsterdamse samenwerkingsverband voor kunstmatige intelligentie, en Health-RI, dat zich inzet voor een landelijke geïntegreerde gezondheidsdata-infrastructuur voor onderzoek, beleid en innovatie.
HDSA faciliteert met deze betere en snellere uitwisseling van zorgdata wetenschappelijk onderzoek naar gezondheid, beter medisch inzicht in hoe mensen langdurig gezond kunnen blijven, gepersonaliseerde preventie en behandeling van ziekten. De samenwerking is een eerste stap in de aansluiting op (een nog te bouwen) nationale infrastructuur vanuit het Integraal Zorgakkoord (IZA) en een Europese samenwerking via het European Health Data Space (EHDS).
Lees het complete bericht via
Community Engagement & AI: Free few-click participation framework based on data and science.🎈

Happy Thursday, all 🎈
👯While Playground 🛝 is busy building the product, we actively talk with architects, developers, and governments. One topic that keeps surfacing is that there isn’t a clear and simple framework for starting community engagement and even convincing internal stakeholders to embark on this adventure without knowing the associated costs and best practices.
For that reason, we are releasing the Playground Framework 🪄. With five simple clicks, you can generate an actionable strategy to help you navigate the complexities of making our cities more inclusive.
✨Play with the framework and share your thoughts with us. Link to public demo video 🔗
💌<strong>Our inbox is open;</strong> let’s build the future of our cities together. 🏙️🍃
CTwalk Map
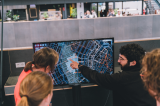
What opportunities for social cohesion do cities provide?
Is your neighbourhood park frequented by a homogenous or diverse mix of people? How many hashtag#amenities can you reach within a short hashtag#walking distance? And do you often encounter people from different walks of life?
I am very excited to introduce to you CTwalk Map, a web tool that seeks to highlight the social cohesion potential of neighbourhoods while also unmasking local access hashtag#inequities. CTwalk maps opportunities that different age groups can reach within a 5 or 15-minute walk.
🚶♀️🚶♂️ It uses granular population, location, and pedestrian network data from open sources to estimate how many children, adults, and elderly hashtag#citizens can reach various destinations in a city within a short walk.
🌐 It offers a simple and straightforward understanding of how the 5 and 15-minute walking environments are shaped by the street network.
➗ It estimates the degree of pedestrian co-accessibility of various hashtag#city destinations.
CTwalk Map is now available for the five largest cities in The Netherlands.
Take a look at the web tool:
https://miliasv.github.io/CTwalkMap/?city=amsterdam
... learn more about CTwalk Map at this link:
[currently does not support mobile phones or tablets]
...and let us know what you think!
Digitale tweeling als gesprekspartner in gebiedsontwikkeling

Zie digitale tweelingen niet als dé oplossing voor maatschappelijke vraagstukken die in gebieden spelen. Data en modellen belichten namelijk slechts een deel van de werkelijkheid. Bij ruimtelijke opgaven, zoals het woningtekort, de energietransitie en natuurherstel, gaat het om het gesprek om te komen tot een gedeelde werkelijkheid. Zorg dat digitalisering hierbij een constructieve rol speelt.
Op de grens van Brabant en Limburg ligt de Peel. Daar komen onder grote tijdsdruk verschillende opgaven samen: transitie van de landbouw, omslag naar hernieuwbare energie inclusief netverzwaringen, woningtekort, verdroging van de Peel en de mogelijke heropening van de vliegbasis Vredepeel. Het maken van die ruimtelijke puzzel vergt samenwerking tussen twintig gemeenten, drie waterschappen, twee provincies, diverse departementen en tal van bedrijven, maatschappelijke organisaties en burgers. Daarnaast vraagt die puzzel een integrale afweging: ingrepen voor de ene opgave kunnen immers vergaande gevolgen hebben voor andere opgaven.
Voor de digitale tweeling is echter geen vraagstuk te complex, schreef Microsoft in een artikel op Ibestuur. Het bedrijf werkt zelfs aan een digitale tweeling van de aarde, met de ambitie om deze beter te besturen voor mens en natuur. Tijdens een conferentie over slimme steden in Barcelona viel de sterke aantrekkingskracht van de digitale tweeling voor beleidsmakers en bestuurders op. ‘Doe mij ook maar zo’n digitale tweeling’ leek de dominante gedachte te zijn. De talrijke pilots en experimenten met digitale tweelingen in het ruimtelijk domein onderstrepen dit.
Hype?
Er lijkt sprake van een ‘hype’: digitale tweelingen als panacee voor gebiedsontwikkeling. Deze ‘hype’ hangt samen met de toenemende hoeveelheid en beschikbaarheid van (real-time) data over onze leefomgeving, zoals lucht-, grond- en waterkwaliteit en energieverbruik. Dit is mede het gevolg van het beter en goedkoper worden van monitoringstechnieken, zoals slimme meters in huis en allerlei soorten sensoren op straat, in drones en satellieten. Daarnaast stimuleert en verplicht de aankomende Omgevingswet het gebruik van data.
Partijen gebruiken verschillende definities voor de digitale tweeling. Doorgaans verwijst de term ‘digitale tweeling’ naar het idee dat een fysieke en virtuele ‘tweeling’ met elkaar in verbinding staan door de uitwisseling van data en informatie. Data over de fysieke wereld voeden de virtuele tweeling en inzichten daaruit kunnen weer worden gebruikt om te interveniëren in de fysieke wereld. Dat helpt bij het maken van allerlei producten – van de bouw van de Boekelose brug tot de BMW fabriek – en het verbeteren van bedrijfsprocessen, zoals het onderhoud en beperking van de CO2-uitstoot van de Airbus.
Hierdoor geïnspireerd, zien veel beleidsmakers en bestuurders de digitale tweeling als een belangrijk middel om besluitvorming – van beleidsvoorbereiding tot implementatie – te verbeteren door de gevolgen van keuzes te simuleren en te visualiseren. In het domein van politiek en bestuur is de digitale tweeling dus meer dan een technologische innovatie; het is een democratische innovatie. Dit roept de vraag op: hoe kan een digitale tweeling de besluitvorming daadwerkelijk verbeteren?
Er bestaat geen eenduidige werkelijkheid
Dat kan door de variëteit en veelzijdigheid van een gebied te erkennen. Een gebied is nooit één monolithische werkelijkheid; er spelen vaak duizend-en-een belangen en processen tegelijk. Toch is zo’n eenduidige werkelijkheid wel precies wat een digitale tweeling suggereert. En daarin schuilt zowel de kracht als het risico van dit instrument. Kracht, omdat het zorgt voor een basis voor een gesprek. En een goed gesprek is de basis voor goede besluitvorming. Risico, omdat zo’n eenduidige werkelijkheid ons kan doen vergeten dat de digitale tweeling selectief is. Hij laat slechts een beperkt aantal variabelen zien. Bovendien, datgene wat subjectief of lastiger meetbaar is, bijvoorbeeld de betekenis van een gebied voor haar inwoners, kunnen we gemakkelijk over het hoofd zien. Terwijl een democratisch proces juist ook voor die zachte waarden aandacht behoort te hebben.
Gesprekspartner
Beschouw een digitale tweeling dus niet als de gedeelde werkelijkheid zelf, maar als gesprekspartner in een breder democratisch proces. Daarbij is ook transparantie van belang over welke data wel aanwezig zijn en welke niet. En over welke modellen gebruikt worden en de aannames die daarbij gemaakt worden. Zo laat de maatschappelijke aandacht voor bijvoorbeeld de stikstofmodellen van het RIVM zien dat data en modellen niet neutraal zijn en ook niet apolitiek, ook al worden ze soms wel zo gepresenteerd. Data, modellen en algoritmes hebben namelijk invloed op hoe we problemen definiëren en begrijpen, wie daarbij betrokken worden en hoe we vervolgens handelen. Of toegepast op besluitvorming: ze bepalen welke maatschappelijke opgaven wel en niet worden opgepakt en hoe en wie wel of niet mee mag praten en beslissen.
Praktijkcases?
Dit artikel is een weergave van een aantal eerste inzichten in een project van het Rathenau Instituut naar de wijze waarop digitale tweelingen kunnen bijdragen aan besluitvorming over gebiedsontwikkeling. Hierin heeft het Rathenau samengewerkt met de Provincie Noord-Holland. Voor het vervolg van dit project is het instituut op zoek naar interessante praktijkcases.
De digitale tweeling als gesprekspartner dus. Hoe doe je dat op een verantwoorde manier? Wie kan hier praktijkcases van laten zien?
Dit artikel is geschreven door Romy Dekker (Rathenau Instituut), Paul Strijp (Provincie Noord-Holland) Allerd Nanninga (Rathenau Instituut) en Rinie van Est (Rathenau Instituut) en gepubliceerd op iBestuur. De auteurs danken Brian de Vogel, Henk Scholten, Arny Plomp, Herman Wilken, Rosemarie Mijlhoff, Jan Bruijn en Martine Verweij voor hun waardevolle inbreng in het project.
Beeld: Shutterstock
Walkability index for Amsterdam 🚶♀️

🚶♀️ How walkable is Amsterdam? 🚶♂️
🏘️ Ever wondered how pedestrian-friendly is your neighbourhood?
Do you feel encouraged and safe to walk in your surroundings?
Do the streets have too much traffic 🚦 and not enough trees 🌳?
Together with Vasileios Milias, we've developed CTstreets map, a new tool where you can check how your street scores in different walkability factors and what might be missing to make it more attractive for pedestrians.
👀 Explore the web tool here: https://miliasv.github.io/CTstreets/?city=amsterdam#15.18/52.371259/4.895385/0/45
🔍 Dive into the methodology and process on our info page: https://miliasv.github.io/CTstreets/info_page/
CTstreets is based on the results of my thesis "Amsterdam on Foot" where I developed a participatory approach to evaluate walkability in every street segment of Amsterdam using open data.
The categories available on the map are Overall walkability, Landscape, Crime Safety, Traffic Safety, Proximity and Infrastructure.
📍 With this tool, you can check how is the walkability per street, neighbourhood or walkshed (5 or 15 minutes) and switch between categories.
A disclaimer about the results presented: While based on the opinions of municipality workers, urban designers and advocates for pedestrian accessibility, this work might not reflect the opinion of everyone. After all, walkability is also influenced by personal factors. Furthermore, the data we used comes from open sources and it might not always be accurate / up to date. Ctstreets aims to enable the exploration of factors that impact walkability according to the experts in a simple, interactive, and fun way, and spark a conversation about how we think and design for pedestrians.
Highlights Data Dilemma's: Kijken onder de grond en samenwerken erboven
English version below
We zien het misschien niet, maar de ondergrond ligt vol met assets en is voortdurend in beweging. Er liggen elektriciteitskabels, gasleidingen, riolering, stadswarmte, glasvezel, en nog veel meer, die constant moeten worden onderhouden, verwijderd, of bijgelegd. De ambities van Nederland voor de energietransitie, snel dataverkeer, mobiliteitsoplossingen, circulaire economie en klimaatadaptie, leggen alleen nog maar meer druk op de schaarse ondergrond. Goed inzicht hebben in wat er precies onder de grond ligt en goede samenwerking tussen de verschillende partijen die de grond in moeten is daarom essentieel.
Tijdens de Data Dilemma’s evenementen van Amsterdam Smart City verkennen we de mogelijkheden voor het gebruik van data en nieuwe technologieën om stedelijke en maatschappelijke uitdagingen aan te pakken, met een focus op verantwoorde digitalisering. Het doel is om data te gebruiken om steden veiliger, schoner en toegankelijker te maken.
In deze editie van Data Dilemma’s, bespraken we het dilemma van de ondergrond: Hoe zorg je dat de data van de ondergrond klopt met de werkelijkheid en hoe kunnen de partijen die de grond in moeten beter samenwerken. De sprekers van dit evenement waren Ceciel Kempers (Alliander), Marco Scheffers (Gemeente Amsterdam) en Vincent van Mierlo (Eurofiber Nederland) die ieder hun tools en dilemma’s deelden als zij met hun organisatie de grond in gaan.
Het Scan de Sleuf project - Ceciel Kempers
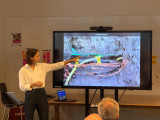
Ceciel Kempers, bedrijfsontwikkelaar bij Alliander, vertelde over hun ‘Scan de sleuf’ project, waarbij ze een 3D scan maken van open werksleuven om inzichtelijk te maken waar alle assets precies liggen. Bij Alliander levert de huidige aanpak van schetsverwerkingen op dit moment nog veel problemen op. De doorlooptijd van assetregistratie is op het moment 550 dagen. Dit zorgt ervoor dat de data over de ondergrond soms flink achterloopt op de werkelijkheid wat weer kan leiden tot graafschade, gevaarlijke situaties en veel uren die gaan naar het zoeken van assets.
Volgens Ceciel moet de buitensituatie leidend gemaakt worden door middel van een 3D scan, een Scan de Sleuf, waar er letterlijk een scan gemaakt wordt van de werksleuf in de grond wanneer deze open ligt. Dit kan gewoon met een tablet of smartphone worden gedaan en de technologie zal beschikbaar zijn voor iedereen die de grond in moet. Als de grond dan ooit weer open moet, kan er op de 3D scan precies gezien worden waar de kabels zich bevinden. Dit zorgt er op de korte termijn voor dat er minder discussies ontstaan met aannemers over aangelegd werk en dat er minder liggingsregistraties worden afgekeurd. Later zal het ook de registratie versnellen en de kwaliteit van liggingsdata verbeteren. Op de lange termijn zullen ook graafschade en gevaarlijke situaties afnemen.
Een ander groot voordeel van 3D data is dat afstanden nauwkeurig ingemeten kunnen worden door middel van pixelafstanden. Daarnaast kan er een kaart laag, die de kabels en leidingen in de ondergrond weergeven, op de werkelijkheid gelegd worden aan de hand van geo-referentie.
De eindvisie van het Scan de Sleuf project is om een landelijke 3D-database van de ondergrondse situatie te maken: De ‘Understreetview’ van Nederland.
Data samenbrengen in de Digital Twin van de ondergrond - Marco Scheffers
Bij de Gemeente Amsterdam is er vanuit de ambtenaren een werkgroep ondergrond ontstaan, vertelde Marco Scheffers, data-adviseur ondergrond en geo-informatie bij de Gemeente Amsterdam. Volgens hen moest er meer gedaan worden aan de ondergrond in Amsterdam, de huidige kwaliteit van informatie over de ondergrond is onvoldoende om de huidige en toekomstige verdeling van ruimte inzichtelijk te maken. Daarom is er besloten te gaan werken met regie op de ondergrond.
De eerste stap is het vormen van het Datafundament ondergrond, een digitale basis binnen de Amsterdamse Digital Twin. Het bestaat uit relevante ondergrondgegevens van systemen en fenomenen die vitaal zijn voor de stad, denk hierbij aan kabels, leidingen, historische assets, funderingen van gebouwen en fysische eigenschappen van de bodem. Uiteindelijk is het plan om ook 3D informatie te verschaffen en te bouwen aan een Digital Twin van de ondergrond.
Er wordt nu gebouwd aan data over de ondergrond op het platform data.amsterdam.nl. Niet alle data over de ondergrond is openbaar, de KLIC data (Kabels en Leidingen Informatie Centrum) is alleen toegankelijk voor bevoegden. De Digital Twin van Amsterdam is te zien op 3d.amsterdam.nl.
Een dynamische ondergrond zonder z-coördinaat - Vincent van Mierlo
De laatste spreker was Vincent van Mierlo, strategisch adviseur bij Eurofiber Nederland. Eurofiber is gespecialiseerd in het aanleggen van glasvezelaansluitingen, ze werken dus met vitale infrastructuur. Dit betekent dat als deze processen uitvallen of verstoord worden, er snelle reparaties vereist zijn. Dit leidt met hun 60.000 kilometer aan glasvezelkabel tot 500 handelingen per week.
Bij 3D visualisaties van de bovengrond wordt het meteen duidelijk of de data klopt, maar bij 3D visualisaties van de ondergrond kun je niet makkelijk zien of de data correct is. Dit kan een risico op schade aan netwerken veroorzaken omdat er wordt uitgegaan van theoretische data. De leggegevens zijn niet per se hetzelfde zijn als de liggegevens (en dat die termen maar één letter van elkaar verschillen leidt ook tot verwarring). De ondergrond blijft dynamisch waardoor ook kabels en leidingen in de werkelijkheid anders gepositioneerd kunnen zijn dan verwacht. In principe liggen glasvezelkabels op 60 cm diepte maar dat is lang niet altijd het geval. Daarom zou 3D visualisaties kunnen helpen met het verschaffen van niet alleen de X en Y coördinaten, maar ook de Z-coördinaten (diepte).
Volgens Vincent is het belangrijk om een geharmoniseerde werkwijze van 3D inmeten in te stellen die op landelijk niveau wordt vastgelegd. Daarnaast moet er eenzelfde taal/jargon worden gekozen. Want als we niet dezelfde taal spreken, dan wordt het onmogelijk om samen te werken.
We willen graag onze sprekers bedanken voor de interessante presentaties en het publiek voor de waardevolle discussie. De dilemma’s in de ondergrond brengen een hoop vragen met zich mee waar we graag met het Amsterdam Smart City netwerk aan verder werken.
Vervolg: We gaan door met het vraagstuk: Hoe kijken we onder de grond zonder te graven? Waarbij we met partijen die de grond in moeten, en partijen met slimme technologische oplossingen bespreken wat er allemaal mogelijk is om te kijken onder de grond zonder te graven. Heb je ook te maken met de vraagstuk, of kun je helpen met het vinden van een oplossing? Neem dan contact op met noor@amsterdamsmartcity.com.
Data Dilemmas: Looking Below Ground and Collaborating Above
We may not see it, but the underground is filled with assets and is constantly in motion. It contains electricity cables, gas pipelines, sewage systems, district heating, fibre optics, and much more, all requiring regular maintenance, removal, or expansion. The ambitions of the Netherlands for the energy transition, fast data traffic, mobility solutions, circular economy, and climate adaptation only add more pressure to the already limited underground space. Having a clear understanding of what lies beneath the ground and fostering effective collaboration among the various stakeholders involved in underground activities is essential.
During Data Dilemma's, we explore the possibilities for using data and new technologies to address urban and societal challenges, with a focus on responsible digitalization. The goal is to use data to make cities more safe, clean and accessible.
In this edition of Data Dilemmas, we discussed the dilemma of the underground: How to ensure that underground data matches reality and how the parties involved in underground activities can collaborate more effectively. The speakers for this event were Ceciel Kempers (Alliander), Marco Scheffers (City of Amsterdam), and Vincent van Mierlo (Eurofiber Netherlands), each sharing their tools and dilemmas when working beneath the ground.
The Scan the Trench Project - Ceciel Kempers
Ceciel Kempers, a business developer at Alliander, shared insights into their "Scan the Trench" project, where they create a 3D scan of open work trenches to make the exact locations of all assets visible. Alliander's current approach to make a work sketch of the situation is causing significant problems. The asset registration process takes 550 days at present, resulting in outdated data about what's underground, which can lead to excavation damage, hazardous situations, and significant hours spent searching for assets.
According to Ceciel, the outdoor situation should be the guiding force through a 3D scan, a "Scan the Trench," where a scan is created of the open trench in the ground. This can be done with a tablet or smartphone and will be available to anyone who needs to work in the underground. If the ground ever needs to be reopened, the 3D scan can precisely show the location of the assets, reducing disputes with contractors over completed work and rejected location registrations in the short term. In the long term, it will also accelerate asset registration and enhance the quality of location data, reducing excavation damage and dangerous situations.
Another significant advantage of 3D data is the ability to measure distances accurately using pixel distances. Additionally, a map layer depicting underground cables and pipelines can be overlaid on reality through geo-referencing.
The vision for the future of the Scan the Trench project is to create a national 3D database of the underground situation: the "Understreetview" of the Netherlands.
Bringing Data Together in the Digital Twin of the Underground - Marco Scheffers
At the municipality of Amsterdam, a group dedicated to the underground was formed by civil servants, as explained by Marco Scheffers, a data advisor specializing in the underground and geoinformation at the City of Amsterdam. They believe that more attention should be given to the underground in Amsterdam, as the current quality of information about the underground is insufficient to make the current and future spatial distribution transparent. Therefore, a decision was made to work on managing the underground.
The first step involves establishing the Data Foundation for the underground, a digital base within Amsterdam's Digital Twin. It comprises relevant underground data from systems and phenomena vital to the city, such as cables, pipelines, historical assets, building foundations, and soil properties. The ultimate plan is to provide 3D information and build a Digital Twin of the underground. Data about the underground is currently being developed on the platform data.amsterdam.nl. Not all underground data is publicly accessible; the KLIC data (Cables and Pipelines Information Center) is only accessible to authorized personnel. The Digital Twin of Amsterdam can be viewed at 3d.amsterdam.nl.
A Dynamic Underground without Z-Coordinates - Vincent van Mierlo
The final speaker was Vincent van Mierlo, a strategic advisor at Eurofiber Netherlands. Eurofiber specializes in installing fiber optic connections, so they work with critical infrastructure. This means that when these processes fail or are disrupted, quick repairs are required, which results in around 500 actions per week with their network of 60,000 kilometres of fibre optic cables.
With 3D visualizations of the surface, it's immediately clear whether the data is accurate. However, with 3D visualizations of the underground, it's not easy to determine the correctness of the data. This can pose a risk of network damage because it relies on theoretical data. The laying data may not necessarily match the lying locations, and the similarity of the terms "laying" and "lying" also leads to confusion. The underground remains dynamic, and cables and pipelines can be positioned differently in reality than expected. In principle, fibre optic cables are supposed to be at a depth of 60 cm, but this is not always the case. Therefore, 3D visualizations could help provide not only X and Y coordinates but also Z-coordinates (depth).
According to Vincent, it is important to establish a harmonized approach to 3D mapping at a national level. Additionally, a common language/jargon should be adopted because if we don't speak the same language, collaboration becomes impossible.
We would like to thank our speakers for their informative presentations and the audience for their valuable discussions. The underground dilemmas bring forth numerous questions that we are eager to continue addressing with the Amsterdam Smart City network.
Next Steps: We will proceed with the question: How can we look beneath the ground without excavation? We will discuss with parties involved in underground activities and those with smart technological solutions to explore what is possible in investigating beneath the ground. If you are dealing with similar questions or can assist in finding a solution, please contact noor@amsterdamsmartcity.com.
Exploring the Future of Data in the Circular Economy: Highlights from Data Dilemma’s!
Amsterdam, a city with an ambitious goal of becoming fully circular by 2050, envisions a future where materials are continuously reused, waste is minimized, and resource cycles are closed. Achieving this vision hinges on the availability and analysis of data, which allows us to assess the extent to which materials are used, reused, or wasted. However, this data is often elusive, complex to analyse, and, in some cases, not even recorded. These challenges surrounding circular data were the focal point of our recent event, "Data Dilemma's: Collecting Data for the Circular Economy."
During Data Dilemma's, we explore the possibilities for using data and new technologies to address urban and societal challenges, with a focus on responsible digitalization. The goal is to use data to make cities more safe, clean and accessible. But what happens to all the data that is collected? Which dilemmas do we encounter when we collect (personal) data to improve the city.
Apparently, the topic of this edition of Data Dilemma’s was not only of interest to the Amsterdam Smart City team, since this event was completely sold out. This was no surprise, with the three incredible speakers we had lined up: Mersiha Tepic (municipality of Amsterdam), Maarten Sukel (Picnic), and Joris Bouwens (Metabolic).
Mersiha Tepic: Circular Economy Monitor Amsterdam
Mersiha Tepic, Senior Researcher at the Research & Statistics department of the Municipality of Amsterdam, demonstrated the Circular Economy Monitor Amsterdam. This essential tool tracks Amsterdam's progress towards a circular economy and identifies areas requiring further attention.
The monitor gives interesting insights. For instance, it shows that the environmental impact of food is four times as big as the impact of the built environment, even though the amount of materials used in the built environment is four and a half times larger than for food.
It reveals that food has a very high environmental per kilogram compared to materials from the built environment. This is interesting because it makes the total environmental impact of food much higher than the impact of the built environment, even though the built environment uses four times as much mass in materials than food.
For more information on the circular monitor and all its insights, you can check out their (Dutch) website.
During her presentation, Mersiha also delved into the data dilemma she faces in this project—the scarcity of data from significant commercial entities operating within the city. The lack of data from these key players poses a considerable challenge to Amsterdam's circular ambitions, and Mersiha's work sheds light on the importance of bridging these data gaps.
Maarten Sukel: Data-Driven Precision at Picnic
Our second speaker, Maarten Sukel, a Data Scientist at Picnic Technologies, showcased how the online supermarket Picnic leverages data. He presented an innovative approach that combines traditional data sources with images, written descriptions, and geographical information to predict customer preferences accurately. By doing so, Picnic not only optimizes its supply chain but also minimizes waste, aligning with the circular economy's core principles.
Maarten's insights provided a glimpse into how data-driven precision can be a game-changer in the pursuit of sustainability and waste reduction, and he also gave a convincing sales pitch on why you should be a customer of Picnic.
Joris Bouwens: The Promise of Digital Product Passports
Closing the event was Joris Bouwens, a Project Manager and Senior Consultant at Metabolic's Circular Industries team. Joris shed light on Digital Product Passports and their potential to revolutionize the circular economy. These passports offer a comprehensive digital record of a product's lifecycle and environmental impact, empowering consumers to make informed choices and encouraging responsible consumption and recycling.
Joris's presentation highlighted the immense opportunity presented by Digital Product Passports in getting as much value from used products as possible. To fully illustrate the potential of Digital Product Passport, Metabolic has created a visualization of the data flows in four sectors: Electronics, Chemicals, Apparel, and Construction. You can find these visualizations here.
We extend our gratitude to our amazing speakers for their invaluable contributions and to our engaged audience for their active participation in the discussion.
In the next edition of Data Dilemma’s we will delve into the fascinating world of the underground. What cables, tubes, and other assets can be found there, how is the data on these assets shared, and how can we improve collaboration? We hope to see you there on the 26th of October.
Do you have any suggestions for which Data Dillema's we should uncover next? Let us know in the comments below.
Smart building inside and out

Day and night, 114 sensors are collecting data about the use and occupation of the facilities at H20 Esports Campus in Purmerend. Such data can be of great interest to plan work more efficiently and cost effectively. Partners of AMdEX, an Amsterdam Economic Board initiative make sure data is exchanged between trusted parties only. And that any conditions for access and use are enforced.
How many people go in and out a building throughout the day? Do they prefer specific elevators? Which toilet areas are most used? Are bins and soap dispensers full? Facility managers and cleaning companies love that type of information. Unoccupied areas do not need to be serviced as frequently as busy ones. The Esports Campus, an event location for businesses and private parties, was keen to share the sensor data in a safe and trustworthy manner. The entrepreneur reached out to the team of our AMdEX initiative, via the Data Sharing Coalition.
Ready for it
For AMdEX, the request from Esports Campus came at exactly the right time. Previously, the field lab at the Marineterrein in Amsterdam proved how environmental and liveability data can be accessed and shared in a trusted environment – after the data owner and data user had agreed on simple terms. “We were ready for a more complicated case,” says Hayo Schreijer (Dexes), one of the founding partners of AMdEX. “The case at Esports Campus is a mix of private and public data, collected in a private space and to be shared over the Internet. Also, a lot more parties would be involved than in the previous Marineterrein case.”
Endorsing partner KPN
KPN is AMdEX’ endorsing partner for connectivity and network infrastructure. KPN’s infrastructure could enable this innovative entrepreneur to collect and share this data reliably with his business partners. Carolien Nijhuis is EVP Internet of Things and Dataservices at KPN. She says: “This smart building project is next level complexity. It combines all the issues we think are important. Safe and trusted exchange of data is necessary to solve the bigger issues in our society. In this project, KPN provides interoperability and connectivity according to European standards of privacy and security.” It is tempting to think that data exchange is all about technology. It is not. “Besides being innovative, using professional technology, data exchange is very much about legal and organisational issues”, says Schreijer.
New terms and conditions
The Esports Campus pilot ran in parallel with a next phase of the field lab at the Marineterrein. Tom van Arman (Tapp), says: “At Marineterrein we measure environmental factors and occupancy of the public space: water quality, temperature, numbers of people. Esports is a private space that collects more personal and commercially sensitive data. We had to consider new terms and conditions in the agreements with all parties involved. We also included the principles of the Tada Manifesto, that prescribe safe, inclusive sharing and usage of data.” Collecting data inside a building results in whole new datasets to play with.
Prototype for all-in-one app
This summer, a milestone was reached: a prototype of Facility Apps, the all-in-one app solution for cleaning and facility management. Data from the Esports Campus is made available to the cleaning partners through this app, allowing them to plan the work more efficiently. The data in the app is contained in a ‘Solid Pod’, a decentralised data store. When data is stored in someone’s Pod, they control which people and applications can access it. The AMdEX layer verifies the identity of parties that want to access the data and authorises them to do so – if they are certified parties. Schreijer clarifies that AMdEX does not ‘see’ the data. It tells systems whether access or usage of data is allowed and makes these decisions auditable. Nijhuis also emphasises that KPN enables the technical data exchange and has no access to the actual data. The next step is to evaluate the app with the users.
Great potential for smart cities
This pilot has shown that private data can be shared reliably between private partners. Combined with the results from the public space of Marineterrein, all three partners see great potential for smart city applications. City planning based on actual data, more efficient energy management of buildings or even industrial areas, innovation in sustainable logistics. “Especially when we all work together,” concludes Nijhuis. “If you run alone, you go faster, but together you go farther.”
Text: Karina Meerman
Investeren in de Metropool Amsterdam doen we samen
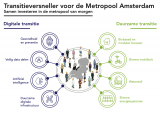
Welke investeringen zijn nodig voor de transitie naar de slimme, groene, gezonde Metropool van Morgen? Onderzoeksbureau Birch bracht het in kaart, in opdracht van de Metropoolregio Amsterdam en Amsterdam Economic Board.
Het rapport van Birch inventariseert de ambities en plannen van regionale kennisinstellingen, bedrijven, maatschappelijke organisaties en overheden. En analyseert welke belangrijke vervolgstappen de regio nog moet nemen. Door voort te bouwen op de aanbevelingen hopen we de mogelijkheid tot investeren in de hele metropool te vergroten.
De focus ligt daarbij op transitie-thema's binnen digitalisering en duurzaamheid:
⦿ Gezondheid en preventie
⦿ Veilig datadelen
⦿ Artificial Intelligence
⦿ Duurzame digitale infrastructuur
⦿ Biobased en modulair bouwen
⦿ Slimme mobiliteit
⦿ Waterstof
⦿ Slimme energiesystemen
Ben jij met jouw organisatie betrokken bij een van die thema's? Lees het artikel en neem contact op om mee te denken over investeringsmogelijkheden.
Transition Day 2023: Digital identity and implementing new electronic identification methods
The Digital Government Act (Wet Digitale Overheid) aims to improve digital government services while ensuring citizens' privacy. An important part of this law is safe and secure logging in to the government using new electronic identification methods (eIDs) such as Yivi (formerly IRMA). The municipality of Amsterdam recently started a pilot with Yivi. Amsterdam residents can now log in to “Mijn Amsterdam” to track the status of complaints about public area’s. But how do you get this innovation, which really requires a different way of thinking, implemented?
Using the Change Curve to categorise barriers
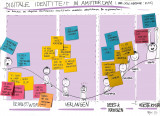
At the Transition day (June 2023), Mike Alders (municipality of Amsterdam) invited the Amsterdam Smart City network to help identify the barriers and possible interventions, and explore opportunities for regional cooperation. Led by Coen Smit from Royal HaskoningDHV, the participants identified barriers in implementing this new technology from an organisational and civil society perspective. After that, the participants placed these barriers on a Change Curve, a powerful model used to understand the stages of personal transition and organization stage. Using the Change Curve, we wanted to give Mike some concrete guidance on where to focus his interventions on within the organisation. The barriers were categorised in four phases:
- Awareness: associated with anxiety and denial;
- Desire: associated with emotion and fear;
- Knowledge & ability: associated with acceptance, realisation and energy;
- Reinforcement: associated with growth.
Insights and next steps
In the case of digital identity and the implementation of eID’s, such as Yivi, it appears that most of the barriers are related to the first phase of awareness. Think of: little knowledge about digital identity and current privacy risks, and a lack of trust in a new technology. Communication is crucial to overcome barriers in the awareness. To the user, but also internally to employees and the management. Directors often also know too little about the topic of digital identity.
By looking at the different phases in the change process, we have become aware of the obstacles and thought about possible solutions. But we are still a long way from full implementation and acceptance of this new innovation. For that, we need different perspectives from business, governments and knowledge institutions. This way, we can start creating more awareness about digital transformations and identity in general, which will most likely lead to wishes for more privacy-friendly and easier way of identifying online. Besides focusing on creating more awareness about our digital identity, another possible next step is to organise a more in-depth session (deepdive) with all governmental organisations in the Amsterdam Smart City network.
Do you have any tips or questions in relation to Mike’s project about Digital Identity and electronic Identification? Please get in touch with me through sophie@amsterdamsmartcity.com or leave a comment below.
Beep for Help, direct hulp aan huis
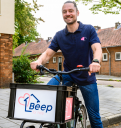
Beep for help ontzorgt alle Amsterdammers die wel wat hulp thuis kunnen gebruiken.
De oplossing voor ouderen die prettig thuis willen blijven wonen, overbelaste mantelzorgers of mensen die meer tijd willen voor ontspanning.
Makkelijk boeken van hulp bij boodschappen, koken, schoonmaken, tuinieren, huisdieren of gezelschap. Zonder wachtlijsten. Simpel en snel. Wij zijn er trots op een Amsterdamse startup te zijn. Wij werken graag samen met andere organisaties om elkaar te versterken. Neem contact op voor de mogelijkheden.
The Public Stack: a Model to Incorporate Public Values in Technology

Public administrators, public tech developers, and public service providers face the same challenge: How to develop and use technology in accordance with public values like openness, fairness, and inclusivity? The question is urgent as we continue to rely upon proprietary technology that is developed within a surveillance capitalist context and is incompatible with the goals and missions of our democratic institutions. This problem has been a driving force behind the development of the public stack, a conceptual model developed by Waag through ACROSS and other projects, which roots technical development in public values.
The idea behind the public stack is simple: There are unseen layers behind the technology we use, including hardware, software, design processes, and business models. All of these layers affect the relationship between people and technology – as consumers, subjects, or (as the public stack model advocates) citizens and human beings in a democratic society. The public stack challenges developers, funders, and other stakeholders to develop technology based on shared public values by utilising participatory design processes and open technology. The goal is to position people and the planet as democratic agents; and as more equal stakeholders in deciding how technology is developed and implemented.
ACROSS is a Horizon2020 European project that develops open source resources to protect digital identity and personal data across European borders. In this context, Waag is developing the public stack model into a service design approach – a resource to help others reflect upon and improve the extent to which their own ‘stack’ is reflective of public values. In late 2022, Waag developed a method using the public stack as a lens to prompt reflection amongst developers. A more extensive public stack reflection process is now underway in ACROSS; resources to guide other developers through this same process will be made available later in 2023.
The public stack is a useful model for anyone involved in technology, whether as a developer, funder, active, or even passive user. In the case of ACROSS, its adoption helped project partners to implement decentralised privacy-by-design technology based on values like privacy and user control. The model lends itself to be applied just as well in other use cases:
- Municipalities can use the public stack to maintain democratic approaches to technology development and adoption in cities.
- Developers of both public and private tech can use the public stack to reflect on which values are embedded in their technology.
- Researchers can use the public stack as a way to ethically assess technology.
- Policymakers can use the public stack as a way to understand, communicate, and shape the context in which technology development and implementation occurs.
Are you interested in using the public stack in your own project, initiative, or development process? We’d love to hear about it. Let us know more by emailing us at publicstack@waag.org.
'Eerlijk data delen start met goede compliance' – Sander Klous (KPMG)

Het delen van data is een belangrijke motor voor vooruitgang in de samenleving. Ook als die informatie gevoelig is voor privacy en concurrentie. AMdEX, een initiatief van Amsterdam Economic Board en partners, ontwikkelt een manier om data veilig en verantwoord te kunnen delen, met behoud van controle voor data-eigenaars.
Sander Klous (KPMG) is een van de partners die het team achter AMdEX ondersteunen. Dit team werkt aan de ontwikkeling van een 'digitale notaris', die contracten levert aan organisaties die data willen delen. Ook dwingt AMdEX de voorwaarden hierin juridisch af. De contracten ondersteunen eenvoudige datatransacties tussen twee organisaties. Maar ook complexe AI-algoritmen, die toegang moeten hebben tot data die op meerdere plekken is opgeslagen.
Wetten en regels
“Momenteel zijn er geen goede mechanismen om de naleving van de vele regels en voorschriften rond data en AI af te dwingen of zelfs maar te controleren”, zegt Sander Klous. “In andere regelgevingsdomeinen stellen bedrijven als KPMG, als onafhankelijke derde partij, organisaties in staat om hun compliance aan te tonen via een auditproces. Helaas is dit proces ingewikkeld wanneer het gaat om data en AI."
Lees het complete interview met Sander Klous om meer te weten over het belang van eerlijk en veilig data delen.
Stay up to date
Get notified about new updates, opportunities or events that match your interests.

